Standard Deviation Calculator helps you compute deviation for datasets quickly and accurately. Ideal for statistics, data analysis, and research tasks.
Standard Deviation Calculator
Standard deviation is a fundamental statistical measure that quantifies the amount of variation or dispersion in a dataset. Whether you're analyzing financial data, conducting scientific research, or evaluating test scores, understanding standard deviation is crucial for making informed decisions. Our Standard Deviation Calculator simplifies this process, providing accurate results without the complexity of manual calculations.
In this comprehensive guide, we'll explore what standard deviation means, how to calculate it for both population and sample data, and why it's such a valuable statistical tool across various fields. We'll walk through the formulas, provide step-by-step calculation examples, and explain how to interpret the results.
What is Standard Deviation?
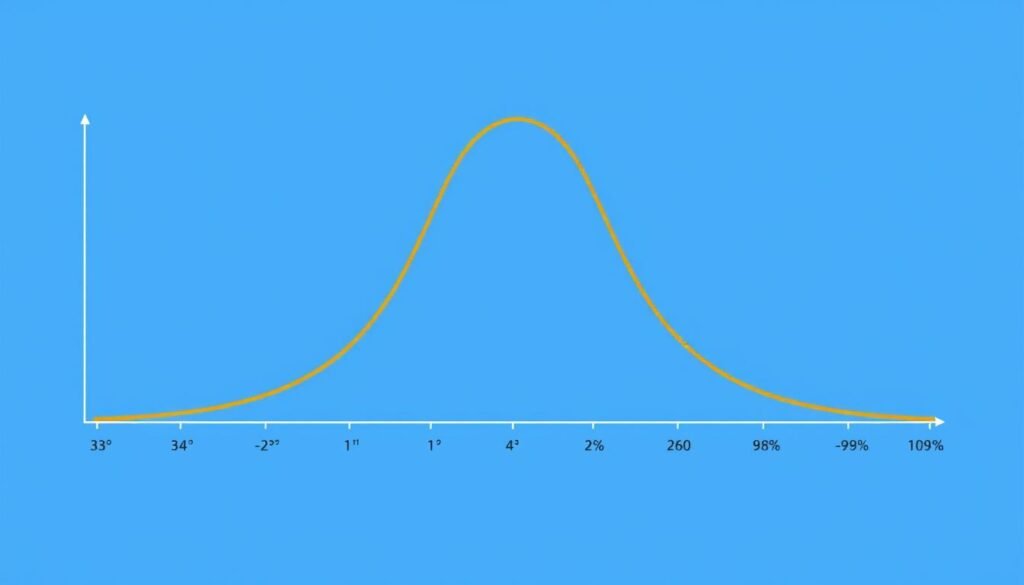
Standard deviation is a statistical measure that quantifies the amount of variation or dispersion in a set of values. A low standard deviation indicates that the data points tend to be close to the mean (average), while a high standard deviation indicates that the values are spread out over a wider range.
In simpler terms, standard deviation tells us how "spread out" our data is from the average. It's like measuring the typical distance between each data point and the mean. This makes standard deviation an essential tool for understanding the consistency and variability within datasets.
For example, if two cities have the same average temperature of 75°F, but one has a standard deviation of 5°F while the other has a standard deviation of 15°F, the second city experiences much more extreme temperature fluctuations despite having the same average.
Need Quick Results?
Skip the manual calculations and get instant standard deviation results with our easy-to-use calculator.
Standard Deviation Formulas
There are two main formulas for calculating standard deviation, depending on whether you're working with an entire population or just a sample from that population.
Population Standard Deviation (σ)
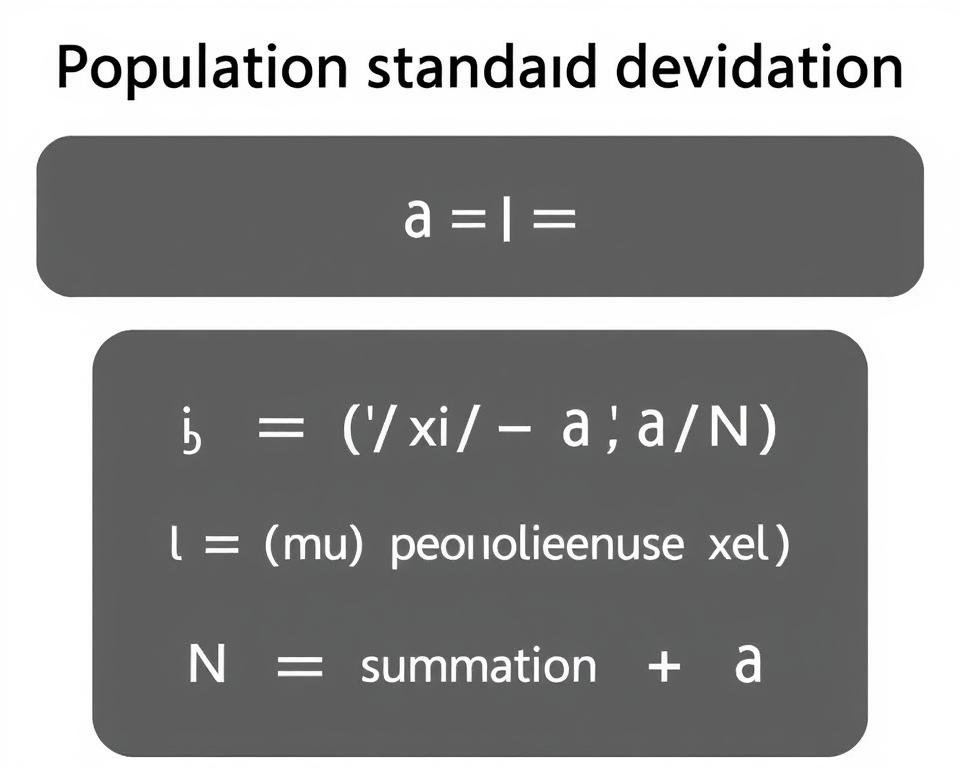
When you have data for an entire population, use the population standard deviation formula:
σ = √[Σ(xᵢ - μ)² / N]
Where:
- σ (sigma) is the population standard deviation
- xᵢ represents each value in the population
- μ (mu) is the population mean
- N is the total number of values in the population
- Σ (sigma) represents the sum of all values
Sample Standard Deviation (s)
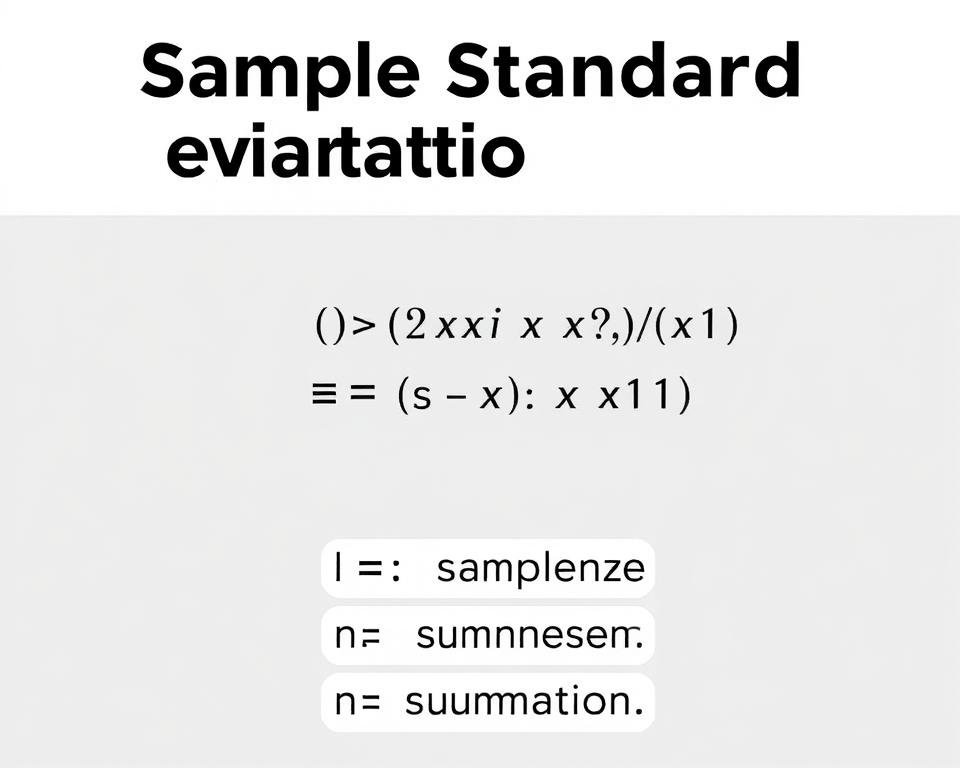
When working with a sample (subset) of a larger population, use the sample standard deviation formula:
s = √[Σ(xᵢ - x̄)² / (n-1)]
Where:
- s is the sample standard deviation
- xᵢ represents each value in the sample
- x̄ (x-bar) is the sample mean
- n is the sample size
- Σ represents the sum of all values
Key Difference Between Population and Sample Formulas
The primary difference between these formulas is the denominator: N for population and (n-1) for sample. The (n-1) term in the sample formula is known as "Bessel's correction" and helps correct the bias in estimating population standard deviation from a sample.
This correction is necessary because samples tend to be clustered more closely around the mean than the entire population, which would lead to underestimating the true population standard deviation without this adjustment.
Step-by-Step Guide to Calculate Standard Deviation
Let's walk through the process of calculating standard deviation manually using a simple example dataset: [5, 7, 3, 9, 11]
Calculating Population Standard Deviation
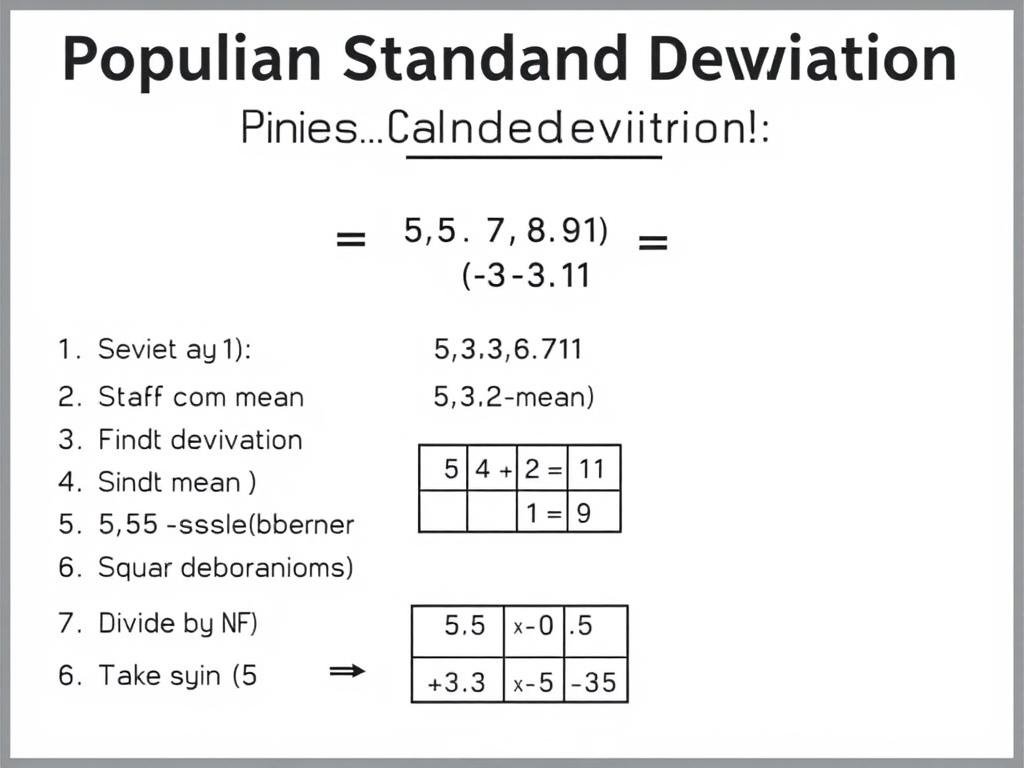
- Calculate the mean (μ):
μ = (5 + 7 + 3 + 9 + 11) / 5 = 35 / 5 = 7 - Find the deviation of each value from the mean:
5 - 7 = -2
7 - 7 = 0
3 - 7 = -4
9 - 7 = 2
11 - 7 = 4 - Square each deviation:
(-2)² = 4
0² = 0
(-4)² = 16
2² = 4
4² = 16 - Calculate the sum of squared deviations:
4 + 0 + 16 + 4 + 16 = 40 - Divide by the total number of values (N):
40 / 5 = 8 - Take the square root to find the standard deviation:
σ = √8 = 2.83
Calculating Sample Standard Deviation
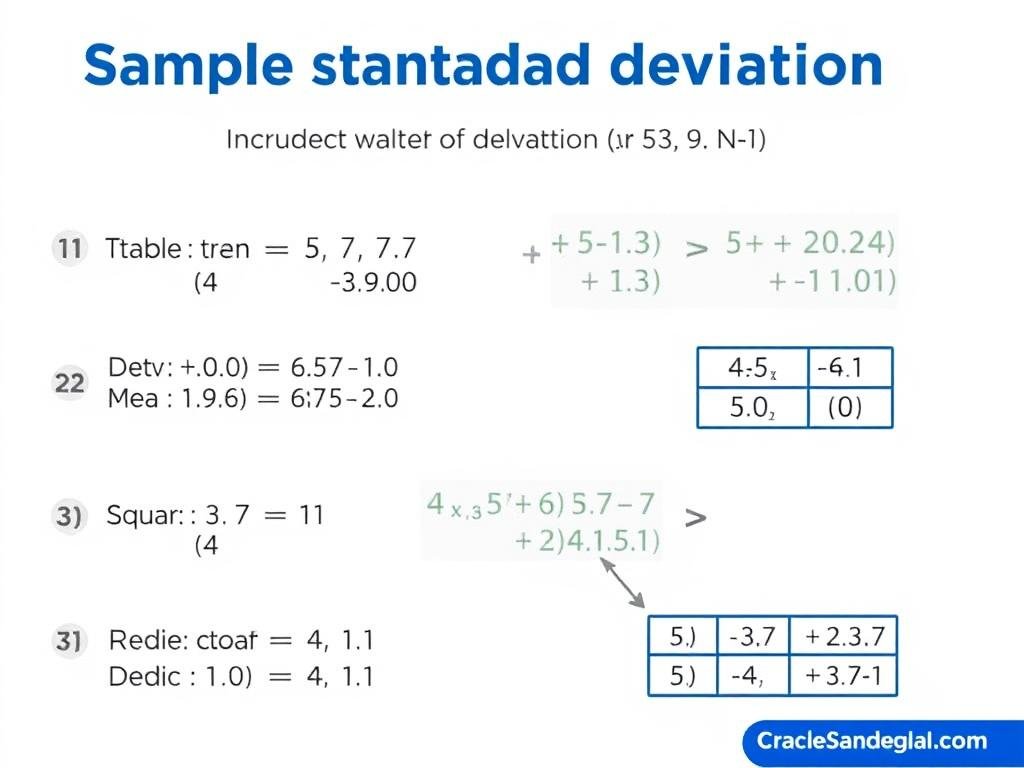
If we treat the same dataset as a sample rather than a population, the calculation changes slightly:
- Calculate the sample mean (x̄):
x̄ = (5 + 7 + 3 + 9 + 11) / 5 = 35 / 5 = 7 - Find the deviation of each value from the mean:
5 - 7 = -2
7 - 7 = 0
3 - 7 = -4
9 - 7 = 2
11 - 7 = 4 - Square each deviation:
(-2)² = 4
0² = 0
(-4)² = 16
2² = 4
4² = 16 - Calculate the sum of squared deviations:
4 + 0 + 16 + 4 + 16 = 40 - Divide by (n-1):
40 / 4 = 10 - Take the square root to find the sample standard deviation:
s = √10 = 3.16
Save Time on Complex Calculations
As you can see, calculating standard deviation manually can be time-consuming. Our calculator handles all these steps instantly.
How to Interpret Standard Deviation Results
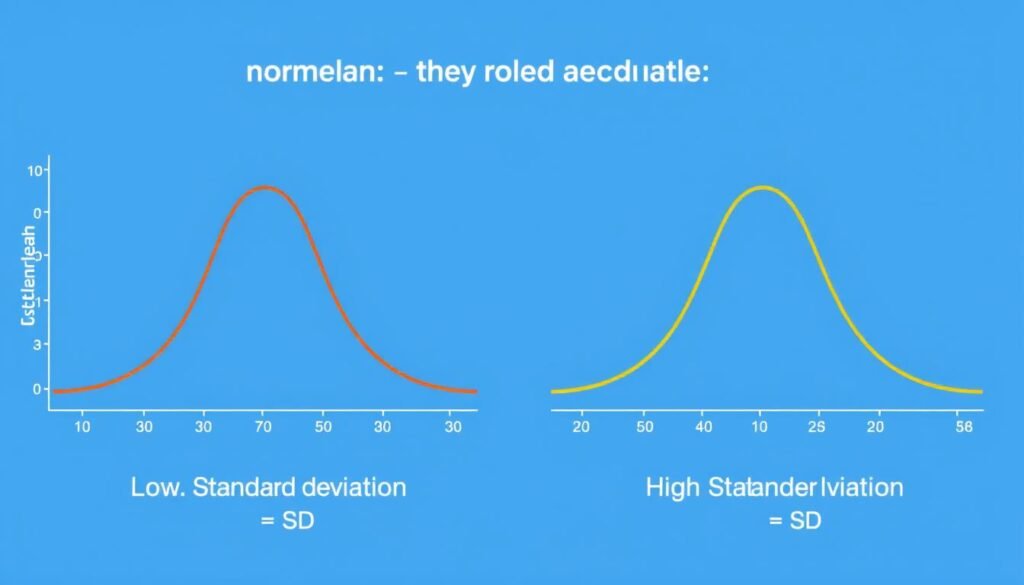
Understanding what your standard deviation value means is just as important as calculating it correctly. Here's how to interpret your results:
Low Standard Deviation
A low standard deviation indicates that data points are clustered closely around the mean. This suggests consistency, reliability, and low variability in your dataset.
For example, a manufacturing process with a low standard deviation in product dimensions indicates consistent quality and tight tolerances.
High Standard Deviation
A high standard deviation indicates that data points are spread out over a wider range of values. This suggests greater variability and diversity in your dataset.
For example, a stock with a high standard deviation in its returns indicates higher volatility and potentially higher risk.
The Empirical Rule (68-95-99.7 Rule)
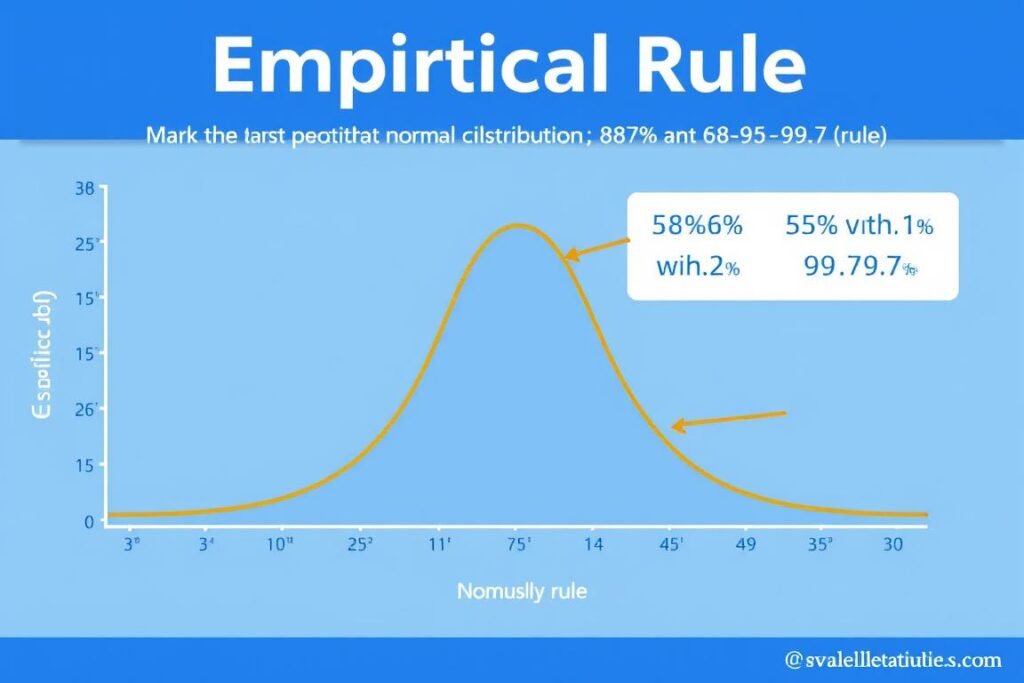
For normally distributed data, the empirical rule provides a useful framework for interpretation:
- Approximately 68% of data falls within one standard deviation of the mean
- Approximately 95% of data falls within two standard deviations of the mean
- Approximately 99.7% of data falls within three standard deviations of the mean
This rule helps you understand the probability of finding values at various distances from the mean, which is valuable for making predictions and identifying outliers.
Real-World Applications of Standard Deviation

Standard deviation is used across numerous fields to measure variability and make data-driven decisions:
Finance and Investment
In finance, standard deviation measures the volatility or risk of investment returns. Higher standard deviation indicates higher risk but potentially higher rewards. Investment portfolios are often designed with specific standard deviation targets to match investor risk tolerance.
Quality Control
Manufacturers use standard deviation to monitor product consistency and identify when processes are going out of specification. Lower standard deviation in product measurements indicates better quality control and consistency.
Weather Forecasting
Meteorologists use standard deviation to understand climate variability and predict weather patterns. Regions with high standard deviation in temperature or precipitation experience more extreme weather fluctuations.
Education and Testing
In educational assessment, standard deviation helps interpret test scores and design grading curves. It shows how widely student performance varies and helps identify exceptional performers in both directions.
Scientific Research
Researchers use standard deviation to measure experimental precision and validate results. Lower standard deviation in repeated measurements indicates more reliable experimental methods and data.
Ready to Apply Standard Deviation to Your Data?
Our calculator handles both population and sample data for all these applications and more.
Why Use Our Standard Deviation Calculator?
Save Time
Manual calculations can be time-consuming, especially with large datasets. Our calculator provides instant results, allowing you to focus on analyzing the data rather than crunching numbers.
Ensure Accuracy
Even small errors in manual calculations can lead to significantly incorrect results. Our calculator eliminates human error, ensuring your standard deviation values are always accurate.
Handle Large Datasets
While our examples use small datasets for clarity, our calculator can process hundreds or thousands of data points instantly—something practically impossible to do by hand.
Switch Between Population and Sample
Our calculator allows you to easily toggle between population and sample standard deviation calculations, giving you flexibility for different statistical needs.
Experience the Benefits Yourself
No registration required. Free to use. Get accurate standard deviation calculations instantly.
Frequently Asked Questions
What is the standard deviation?
Standard deviation is a statistical measure that quantifies the amount of variation or dispersion in a set of values. It indicates how far, on average, each value in the dataset deviates from the mean. A low standard deviation indicates that values tend to be close to the mean, while a high standard deviation indicates values are spread out over a wider range.
What is the difference between population and sample standard deviation?
Population standard deviation (σ) is used when you have data for an entire population and uses N (total count) in the denominator. Sample standard deviation (s) is used when you have data from only a sample of the population and uses (n-1) in the denominator to correct for sampling bias. This adjustment, known as Bessel's correction, helps provide a better estimate of the true population standard deviation.
How do you calculate standard deviation?
To calculate standard deviation: 1) Find the mean of your dataset, 2) Subtract the mean from each value to find deviations, 3) Square each deviation, 4) Sum all squared deviations, 5) Divide by N for population or (n-1) for sample data, 6) Take the square root of the result. Our calculator automates this entire process for you.
What does a high standard deviation mean?
A high standard deviation indicates that the data points are spread out over a wider range of values, showing greater variability or diversity in the dataset. In financial contexts, this often indicates higher volatility or risk. In manufacturing, it might suggest inconsistent quality or processes. The interpretation depends on the specific context and what the data represents.
Can standard deviation be negative?
No, standard deviation cannot be negative. Since it involves squaring the deviations from the mean and then taking the square root of their average, the result will always be zero or positive. A standard deviation of zero occurs only when all values in the dataset are identical, meaning there is no variation at all.
Conclusion
Standard deviation is a powerful statistical tool that helps us understand the spread and variability in datasets. Whether you're a student learning statistics, a researcher analyzing experimental data, or a professional making data-driven decisions, understanding standard deviation is essential for accurate data interpretation.
While calculating standard deviation manually is educational and helps build a deeper understanding of the concept, our Standard Deviation Calculator offers a faster, more accurate solution for practical applications. It handles both population and sample calculations with ease, allowing you to focus on interpreting results rather than performing complex calculations.
Ready to Calculate Standard Deviation?
Try our free, easy-to-use calculator now and get instant, accurate results for your data.