Sample Size Calculator helps you quickly determine the required sample size for surveys or experiments. Accurate, easy, and ideal for research and statistics.
Sample Size Calculator
Determining the right sample size is crucial for any research project. Whether you’re conducting market research, academic studies, or healthcare surveys, the accuracy of your results depends on having an appropriate sample size. This comprehensive guide explains everything you need to know about sample size calculation, from basic concepts to practical applications, helping you ensure your research yields reliable and statistically significant results.
What is a Sample Size?

Sample size refers to the number of individuals, items, or observations included in a study. It represents a subset of a larger population that researchers use to draw conclusions about the entire group. The sample size is denoted by the letter “n” in statistical formulas and plays a critical role in determining how accurately your sample reflects the population you’re studying.
When researchers can’t feasibly study an entire population (which is often the case), they select a representative sample. The size of this sample directly impacts the reliability and validity of the research findings. A properly calculated sample size helps ensure that your results aren’t just coincidental but are statistically meaningful.
Key Point: A sample size that’s too small may lead to inaccurate conclusions, while one that’s unnecessarily large wastes resources without significantly improving accuracy.
Why is Calculating Sample Size Important?
Determining the appropriate sample size before conducting research is essential for several reasons:
Consequences of Too Small a Sample
- Underpowered studies that fail to detect significant effects
- Higher margin of error in your results
- Reduced confidence in your findings
- Potential for misleading conclusions
- Difficulty publishing or defending your research
Consequences of Too Large a Sample
- Wasted resources (time, money, effort)
- Diminishing returns on statistical power
- Potential ethical concerns about unnecessary data collection
- Detecting statistically significant but practically meaningless differences
- Delayed research completion and reporting
A properly calculated sample size strikes the optimal balance between statistical power and resource efficiency. It ensures your research has enough participants to detect meaningful effects while avoiding unnecessary data collection.

Key Factors in Sample Size Calculation
Several statistical concepts determine the appropriate sample size for your research. Understanding these factors is essential for accurate calculations:
Population Size
The total number of individuals in the group you’re studying. For example, if you’re researching voter preferences in a city with 500,000 eligible voters, that’s your population size.
Margin of Error
Also called the confidence interval, this represents how much your sample results might differ from the true population value. Commonly set at ±5% (0.05).
Confidence Level
The probability that your sample accurately reflects the attitudes of your population within your chosen margin of error. Typically set at 95% or 99%.
Standard Deviation
Measures how dispersed the data is in relation to the mean. When unknown, 0.5 is commonly used as it provides the maximum variability.
Effect Size
The magnitude of the difference you expect to detect between groups or from a baseline. Larger effect sizes require smaller samples.
Statistical Power
The probability that your study will detect an effect when there is one. Typically set at 80% or higher for reliable research.

“The quality of your research is only as good as the sample it’s based on. A properly calculated sample size is the foundation of reliable findings.”
The Sample Size Formula
Different research scenarios require different formulas for sample size calculation. Here are the most commonly used formulas:
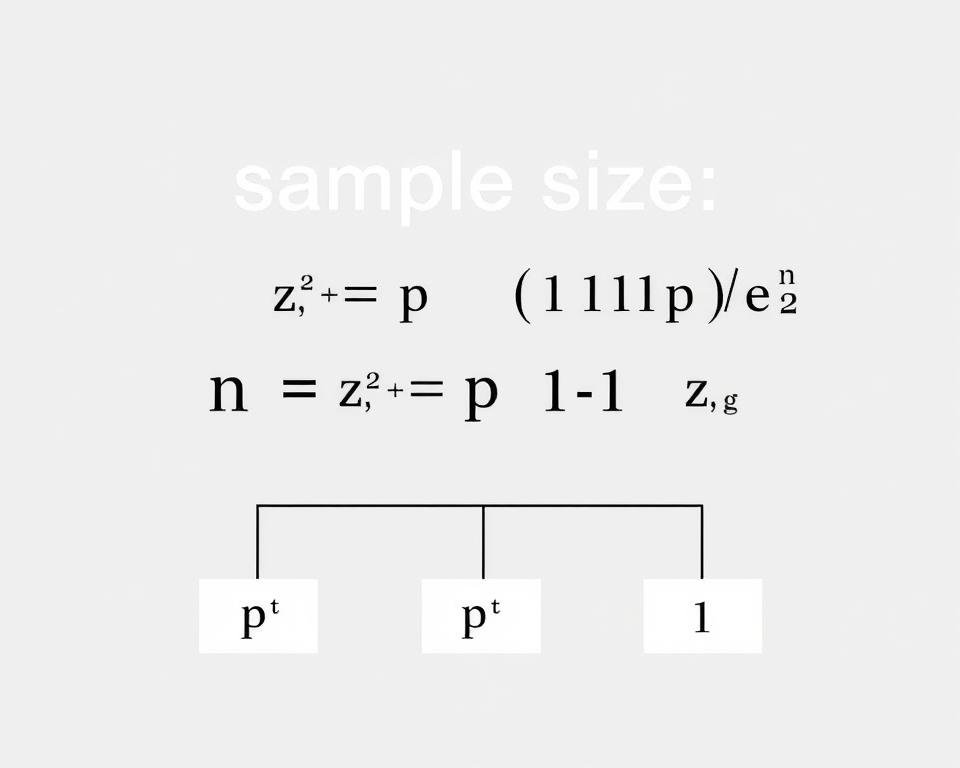
For Infinite or Unknown Population Size (Proportion)

Where:
- n = required sample size
- z = z-score for your chosen confidence level (e.g., 1.96 for 95% confidence)
- p = population proportion (0.5 is used for maximum sample size)
- e = margin of error (as a decimal, e.g., 0.05 for ±5%)
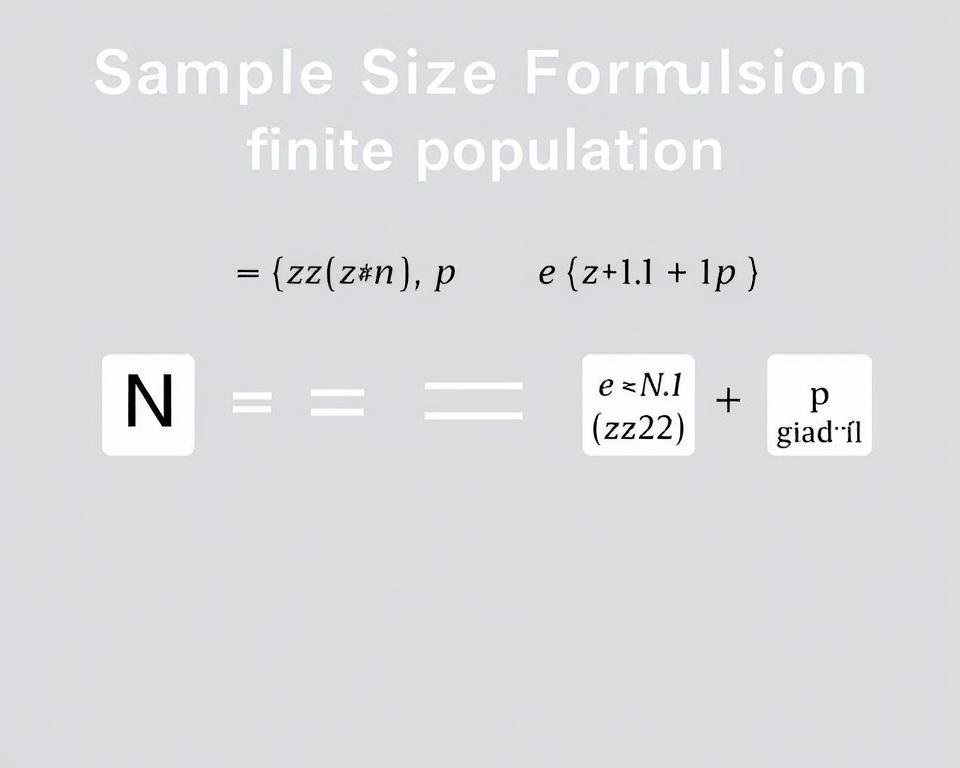
For Known, Finite Population Size

Where:
- N = population size
- z = z-score for your chosen confidence level
- p = population proportion (0.5 is used for maximum sample size)
- e = margin of error (as a decimal)
| Confidence Level | Z-Score | Common Application |
| 90% | 1.645 | Preliminary or exploratory research |
| 95% | 1.96 | Most academic and market research |
| 99% | 2.576 | Critical research (medical, safety) |
Step-by-Step Guide to Calculating Sample Size
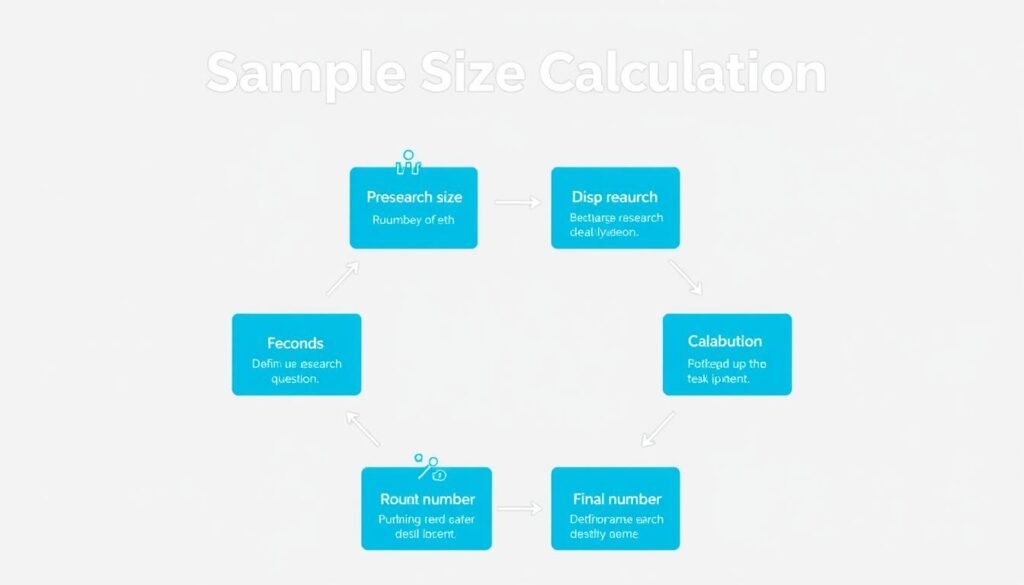
Follow these steps to manually determine the appropriate sample size for your research:
- Define your research question and population
Clearly identify who you’re studying and what you want to learn. - Determine your confidence level
Choose how confident you need to be in your results (typically 95%). - Select your margin of error
Decide how precise your results need to be (commonly ±5%). - Estimate the population proportion
Use 0.5 if unknown, or a value from previous research. - Identify your population size
Determine if it’s finite or infinite/unknown. - Choose the appropriate formula
Use the finite or infinite population formula as needed. - Calculate your sample size
Input your values into the formula and solve for n. - Round up to the nearest whole number
You can’t survey a fraction of a person!

Pro Tip: When in doubt about population proportion, use p = 0.5 (50%). This gives the maximum sample size and ensures you have enough participants for reliable results.
Practical Examples of Sample Size Calculation
Let’s walk through some real-world examples to illustrate how sample size calculation works in different contexts:
Example 1: Market Research Survey

Scenario: A company wants to survey residents of a city with 100,000 people about their product preferences.
- Population size (N) = 100,000
- Confidence level = 95% (z = 1.96)
- Margin of error (e) = 5% (0.05)
- Population proportion (p) = 0.5 (unknown, so using maximum)
Calculation: Using the finite population formula:
n = (100,000 × 1.96² × 0.5 × 0.5) ÷ [(100,000 – 1) × 0.05² + 1.96² × 0.5 × 0.5]
n = 96,040 ÷ 250.9579
n = 382.69 (rounded up to 383)
Result: The company needs to survey at least 383 people to achieve results with a 95% confidence level and ±5% margin of error.
Example 2: Medical Research Study

Scenario: Researchers are testing a new treatment for a condition that affects approximately 50,000 people.
- Population size (N) = 50,000
- Confidence level = 99% (z = 2.576)
- Margin of error (e) = 3% (0.03)
- Population proportion (p) = 0.5
Calculation: Using the finite population formula:
n = (50,000 × 2.576² × 0.5 × 0.5) ÷ [(50,000 – 1) × 0.03² + 2.576² × 0.5 × 0.5]
n = 83,172 ÷ 46.6554
n = 1,782.47 (rounded up to 1,783)
Result: The researchers need at least 1,783 participants to achieve results with a 99% confidence level and ±3% margin of error.
Example 3: Educational Assessment

Scenario: A university wants to assess student satisfaction among its 5,000 enrolled students.
- Population size (N) = 5,000
- Confidence level = 90% (z = 1.645)
- Margin of error (e) = 7% (0.07)
- Population proportion (p) = 0.5
Calculation: Using the finite population formula:
n = (5,000 × 1.645² × 0.5 × 0.5) ÷ [(5,000 – 1) × 0.07² + 1.645² × 0.5 × 0.5]
n = 3,386.28 ÷ 25.5453
n = 132.56 (rounded up to 133)
Result: The university needs to survey at least 133 students to achieve results with a 90% confidence level and ±7% margin of error.
Benefits of Using a Sample Size Calculator
While understanding the manual calculation process is valuable, using a sample size calculator offers numerous advantages:
Accuracy
Eliminates human error in complex calculations, ensuring your sample size is precisely determined based on your statistical parameters.
Efficiency
Saves significant time compared to manual calculations, allowing you to focus on research design and implementation rather than mathematical work.
Accessibility
Makes statistical concepts more approachable for researchers without extensive statistical training, democratizing rigorous research methods.
Consistency
Provides standardized results that can be easily replicated and verified by other researchers or stakeholders in your project.
Flexibility
Allows quick recalculation with different parameters, making it easy to explore various scenarios and confidence levels for your research.
Credibility
Enhances the scientific rigor of your research by ensuring your sample size is statistically sound and defensible to peers and reviewers.

Ensure Your Research Stands on Solid Statistical Ground
Proper sample size calculation is the foundation of reliable research. By understanding these concepts and applying them correctly, you can conduct studies that yield meaningful, accurate, and defensible results.
Frequently Asked Questions About Sample Size Calculation
What is a good sample size?
A “good” sample size depends on your specific research context, including population size, desired confidence level, and acceptable margin of error. Generally, larger samples provide more reliable results, but there’s a point of diminishing returns. For most academic and market research, a sample size that provides a 95% confidence level with a ±5% margin of error is considered adequate. For small populations (under 1,000), you might need to sample 30-40% of the population, while for large populations (over 100,000), even a sample of 400 can be sufficient.
How does population size affect sample size?
Counterintuitively, the required sample size doesn’t increase proportionally with population size. For very large populations, the sample size needed to achieve a given confidence level and margin of error reaches a point of stability. For example, the sample size needed for a population of 100,000 isn’t much different from what’s needed for a population of 1,000,000, assuming the same confidence level and margin of error. This is why the “infinite population” formula works well for very large populations.
What happens if my sample size is too small?
A sample that’s too small can lead to several problems: increased margin of error, reduced statistical power (making it harder to detect significant effects), and potentially misleading or unreliable results. Underpowered studies may fail to detect real effects or relationships in your data, leading to false negatives. Additionally, small samples are more vulnerable to outliers and sampling bias, which can skew your results.
Can I use the same sample size for qualitative research?
Qualitative research typically uses different approaches to sample size determination than quantitative research. Rather than statistical power, qualitative research often relies on the concept of “saturation” – the point at which additional data collection no longer yields new insights. Sample sizes for qualitative studies are generally much smaller, often ranging from 5-30 participants depending on the methodology. The formulas discussed in this article are primarily designed for quantitative research.
How do I account for non-response in my sample size calculation?
To account for non-response, you should adjust your calculated sample size upward based on your expected response rate. For example, if you calculate that you need 400 responses and expect a 50% response rate, you should plan to distribute your survey to 800 people (400 ÷ 0.5 = 800). Historical response rates for similar studies in your field can help you estimate an appropriate adjustment factor. Always aim to maximize response rates through good survey design and follow-up procedures.

Conclusion: The Power of Proper Sample Size Calculation
Determining the right sample size is a critical step in any research process. It balances the need for statistical reliability with practical constraints like time and resources. By understanding the key concepts and formulas behind sample size calculation, you can ensure your research yields meaningful results that accurately represent your target population.
Remember that while statistical formulas provide a scientific foundation for your sample size decisions, research also involves practical considerations. The perfect sample size strikes a balance between statistical power and real-world feasibility. Whether you’re conducting market research, academic studies, or clinical trials, taking the time to properly calculate your sample size will strengthen the validity and impact of your findings.
Make Your Research Count
Armed with the knowledge of proper sample size calculation, you’re now better equipped to design studies that produce reliable, meaningful results. Apply these principles to ensure your next research project stands on solid statistical ground.