Use our Annuity Calculator to estimate growth and payouts from your annuity. Plan your retirement and manage your investments with confidence.
Planning for retirement requires understanding how your investments will generate income in the future. An annuity calculator helps you estimate the potential returns from annuity investments, allowing you to make informed decisions about your financial future. Whether you’re considering a fixed, variable, or indexed annuity, our comprehensive calculator gives you the tools to project your future income and compare different annuity options.
Understanding Annuities and Why Calculating Them Matters
An annuity is a financial product designed to provide a steady stream of income, typically during retirement. It’s essentially a contract between you and an insurance company where you make a lump sum payment or series of payments, and in return, the insurer agrees to make periodic payments to you beginning immediately or at some point in the future.
Calculating annuity returns is crucial because it helps you:
- Determine if an annuity aligns with your retirement goals
- Compare different annuity options and providers
- Understand how much income you can expect in retirement
- Plan for tax implications of annuity investments
- Make informed decisions about allocation of retirement funds
Without proper calculations, you might choose an annuity that doesn’t provide adequate income or miss opportunities for better returns. Our annuity calculator simplifies this process, giving you clear projections based on your specific situation.
Ready to Calculate Your Potential Annuity Returns?
Use our free calculator to estimate your future annuity payments and plan your retirement with confidence.
Types of Annuities: Choosing the Right Option
Different types of annuities serve various financial goals. Understanding these options is essential before using an annuity calculator to estimate returns.
Fixed vs. Variable Annuities
Fixed Annuities
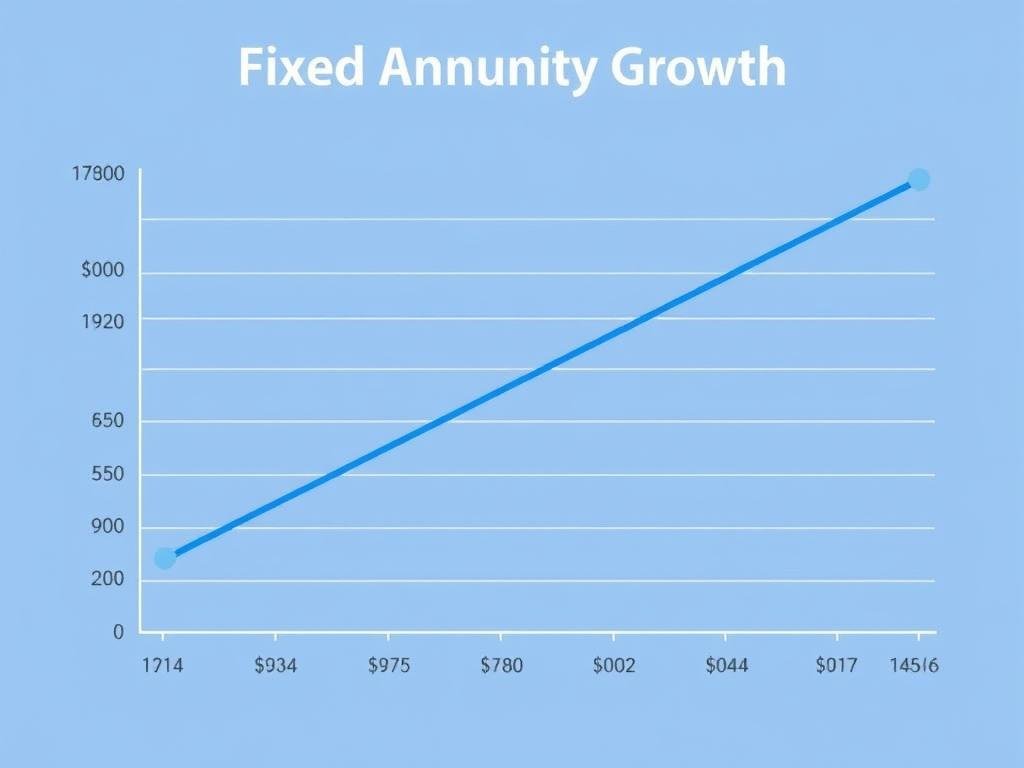
Fixed annuities pay a guaranteed amount based on the interest rate at the time you sign the contract. They provide predictable income with minimal risk, making them suitable for conservative investors focused on stability rather than growth potential.
The interest rate typically remains constant throughout the contract term, though some fixed annuities offer rate adjustments at specified intervals.
Variable Annuities
Variable annuities offer payments that fluctuate based on the performance of underlying investments, typically mutual funds. They provide greater growth potential but come with increased risk since the principal isn’t guaranteed.
These annuities allow you to choose investment options, giving you more control over potential returns but requiring more active management.

Immediate vs. Deferred Annuities
Immediate Annuities
Immediate annuities begin paying income shortly after purchase, typically within a year. They’re ideal for retirees who want to convert a portion of their savings into guaranteed income right away.
These annuities are purchased with a lump sum and provide a predictable income stream for life or a specified period, depending on the contract terms.
Deferred Annuities
Deferred annuities delay payments until a future date, allowing your investment to grow tax-deferred over time. They’re suitable for those still saving for retirement who want to secure future income.
The longer the deferral period, the higher your eventual payments may be, as your investment has more time to accumulate interest or investment returns.
Indexed Annuities
Indexed annuities combine features of both fixed and variable annuities. They offer returns based on a specific market index (like the S&P 500) while providing some protection against market downturns. These annuities typically guarantee a minimum return rate while capping the maximum return you can earn when markets perform well.
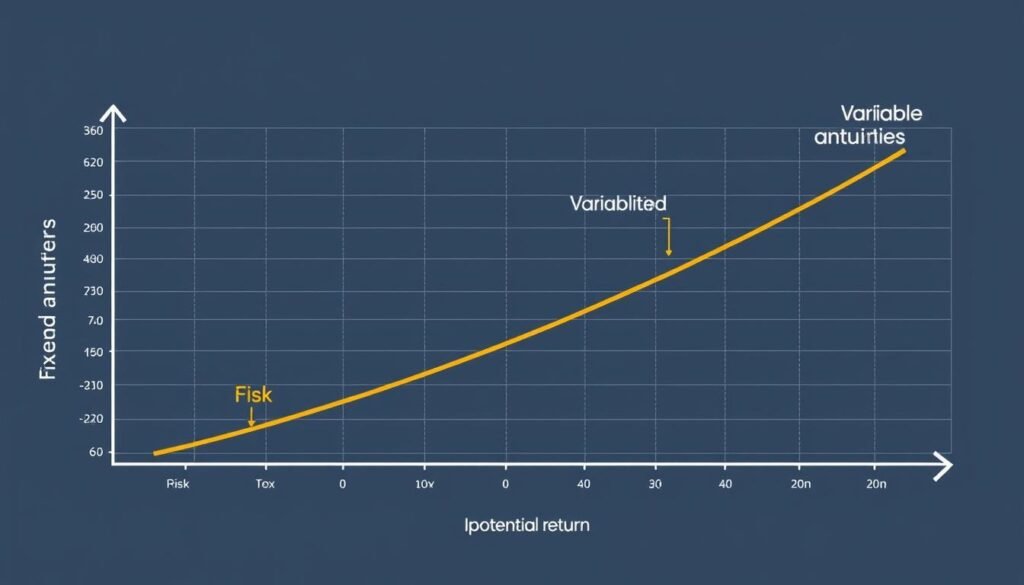
When choosing an annuity type, consider your risk tolerance, income needs, and time horizon. The right annuity balances security and growth potential based on your unique retirement goals.
How Annuity Calculators Work: Understanding the Math
Annuity calculators use financial formulas to project future values and payment amounts based on several key inputs. Understanding these calculations helps you interpret results accurately and make informed decisions.
Key Inputs for Annuity Calculations
- Initial investment (principal) – The starting amount you invest in the annuity
- Additional contributions – Regular deposits you plan to make (for deferred annuities)
- Interest rate – The annual rate of return on your investment
- Time period – The length of the accumulation or payout phase
- Payout frequency – How often you’ll receive payments (monthly, quarterly, annually)
- Annuity type – Fixed, variable, or indexed, which affects the calculation method
Common Annuity Formulas
Annuity calculators typically use these formulas to determine future values and payment amounts:
Future Value of an Ordinary Annuity
For calculating how much your regular contributions will grow to over time:
FV = PMT × [(1 + r)^n – 1] ÷ r
Where:
FV = Future value
PMT = Regular payment amount
r = Interest rate per period
n = Number of periods
Payment Amount for an Immediate Annuity
For determining how much income you’ll receive from a lump sum investment:
PMT = PV × [r × (1 + r)^n] ÷ [(1 + r)^n – 1]
Where:
PMT = Regular payment amount
PV = Present value (initial investment)
r = Interest rate per period
n = Number of periods
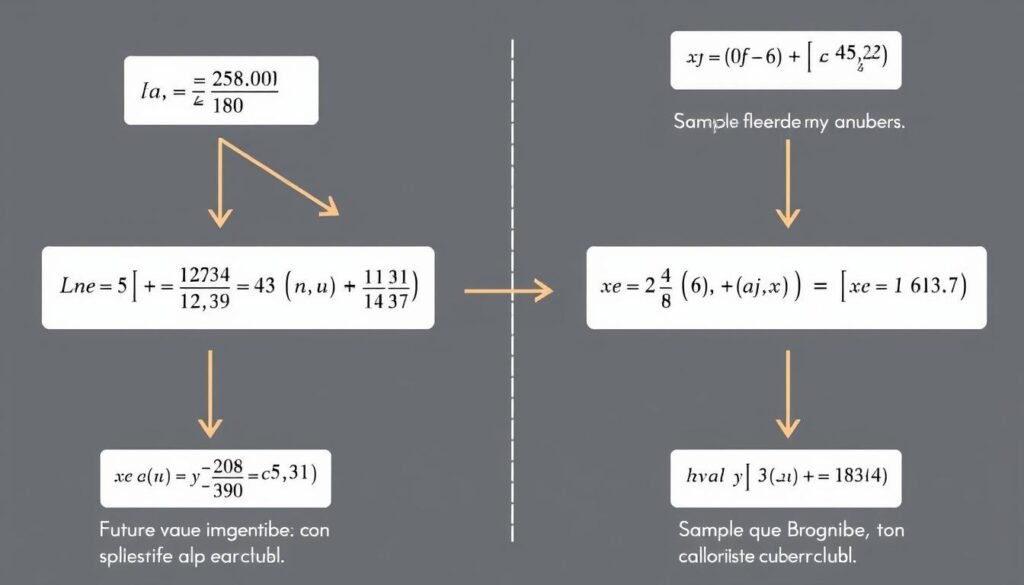
While these formulas form the foundation of annuity calculations, modern calculators also account for additional factors like inflation, taxes, and different payout options to provide more accurate projections.
Note: Annuity calculators provide estimates based on the information you input. Actual returns may vary based on market performance, changes in interest rates, and specific contract terms.
Step-by-Step Guide to Using Our Annuity Calculator
Our annuity calculator is designed to be intuitive and user-friendly. Follow these steps to get accurate projections for your annuity investments.
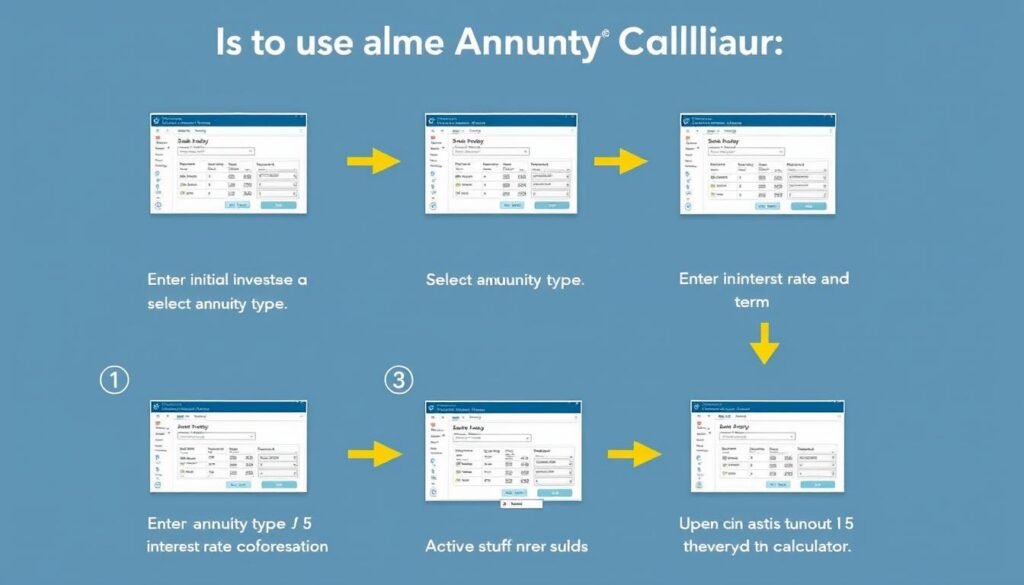
- Select your annuity type – Choose between fixed, variable, indexed, immediate, or deferred annuity options based on your financial goals.
- Enter your initial investment – Input the lump sum amount you plan to invest or have already invested in an annuity.
- Specify additional contributions – For deferred annuities, enter any regular contributions you plan to make, along with the frequency (monthly, quarterly, annually).
- Set your interest rate – Enter the expected annual rate of return. For fixed annuities, use the guaranteed rate; for variable or indexed annuities, use a conservative estimate based on historical performance.
- Define your time period – Enter the accumulation period (for deferred annuities) or the payout period (for immediate annuities).
- Choose payout options – Select whether you want payments for a specific period or for life, and specify the payment frequency.
- Review results – Examine the projected future value, expected payment amounts, and total return on investment.
Ready to Calculate Your Annuity Returns?
Use our comprehensive calculator to get personalized projections based on your specific financial situation.
Tips for Getting Accurate Results
- Use realistic interest rates – Based on current market conditions and the specific annuity type you’re considering
- Account for inflation – Consider how inflation might affect the purchasing power of your future income
- Include all fees – Factor in any administrative fees, surrender charges, or commissions
- Compare multiple scenarios – Try different inputs to see how changes affect your potential returns
- Consider tax implications – Remember that annuity payments are typically taxed as ordinary income
Real-World Examples: Annuity Calculations in Action
To illustrate how annuity calculations work in practice, let’s examine several scenarios with different annuity types and financial goals.
Example 1: Fixed Immediate Annuity
Scenario: John, age 65, wants to convert $200,000 of his retirement savings into guaranteed income starting immediately.
Inputs:
- Initial investment: $200,000
- Annuity type: Fixed immediate
- Interest rate: 4.5%
- Payout option: Life with 10-year period certain
Result: John would receive approximately $1,050 per month ($12,600 annually) for the rest of his life, with guaranteed payments to his beneficiaries if he dies within the first 10 years.
Example 2: Deferred Annuity with Regular Contributions
Scenario: Sarah, age 45, wants to build retirement income by making regular contributions to a deferred annuity.
Inputs:
- Initial investment: $50,000
- Monthly contributions: $500
- Annuity type: Fixed deferred
- Interest rate: 3.75%
- Deferral period: 20 years
- Payout option: Life only
Result: By age 65, Sarah’s annuity would grow to approximately $345,000, providing about $1,975 in monthly income ($23,700 annually) for life.
Example 3: Indexed Annuity Comparison
Scenario: Michael, age 55, is considering an indexed annuity with $150,000 and wants to compare potential outcomes with different cap rates.
Inputs:
- Initial investment: $150,000
- Annuity type: Indexed deferred
- Deferral period: 10 years
- Comparison: 4% cap rate vs. 6% cap rate
Result: With a 4% cap rate, Michael’s annuity might grow to approximately $222,000 after 10 years. With a 6% cap rate, it could reach about $268,000, resulting in a difference of $46,000 in accumulated value.
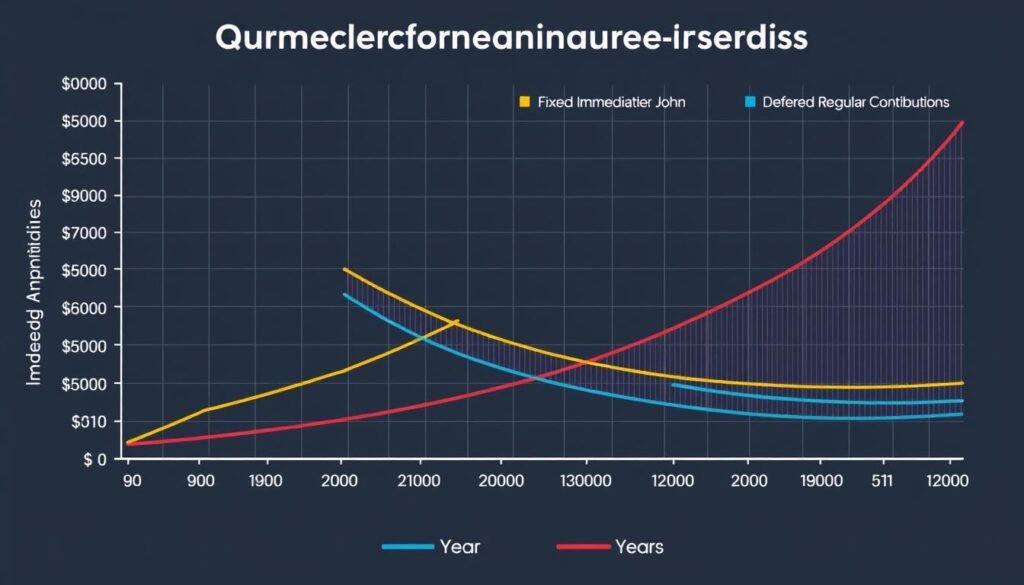
These examples demonstrate how different annuity types and parameters can significantly impact your financial outcomes. Using an annuity calculator helps you visualize these scenarios and make informed decisions based on your specific needs and goals.
Benefits and Limitations of Annuity Calculators
While annuity calculators are valuable tools for retirement planning, it’s important to understand both their strengths and limitations.
Benefits of Annuity Calculators
- Quick estimates – Get instant projections without complex manual calculations
- Scenario comparison – Easily compare different annuity types, interest rates, and contribution amounts
- Visual representation – See how your investment grows over time through charts and graphs
- Accessibility – Calculate potential returns anytime, anywhere, without financial advisor fees
- Educational value – Learn how different factors affect your annuity returns
- Decision support – Make more informed choices about retirement planning
Limitations of Annuity Calculators
- Simplified assumptions – May not account for all real-world variables
- Market unpredictability – Cannot predict future interest rates or market performance
- Fee exclusions – Some calculators don’t factor in all fees and charges
- Tax considerations – Often don’t account for tax implications
- Personalization limits – Cannot fully address individual financial situations
- No professional guidance – Lack the nuanced advice a financial advisor provides

Best Practice: Use annuity calculators as a starting point for retirement planning, but consult with a financial advisor before making significant investment decisions. They can provide personalized advice based on your complete financial picture.
Remember that calculators provide estimates based on the information you input. Actual returns may vary based on market conditions, contract terms, and other factors that calculators may not fully account for.
How to Choose the Right Annuity Based on Calculator Results
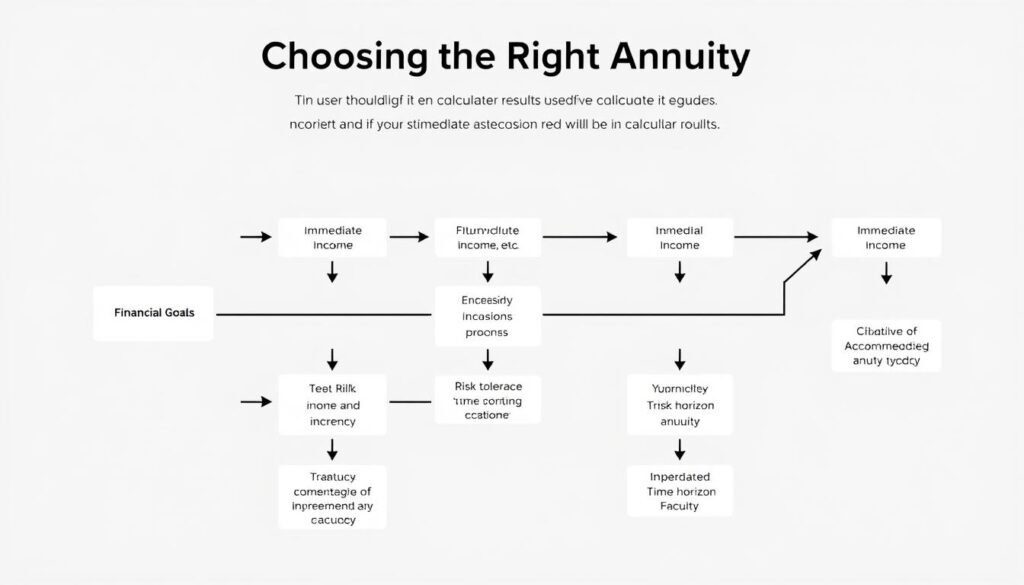
Once you’ve used an annuity calculator to explore different options, you’ll need to interpret the results and determine which annuity best fits your financial goals. Here’s how to make that decision.
Key Factors to Consider
Financial Goals
Determine whether your primary objective is immediate income, future income security, legacy planning, or growth potential. Different annuities serve different purposes:
- Income now: Immediate annuity
- Future income: Deferred annuity
- Growth with safety: Fixed indexed annuity
- Maximum growth potential: Variable annuity
Risk Tolerance
Assess your comfort level with investment risk and market fluctuations:
- Low risk tolerance: Fixed annuities provide guaranteed returns
- Moderate risk tolerance: Indexed annuities offer some market participation with downside protection
- Higher risk tolerance: Variable annuities provide greater growth potential but with market exposure
Evaluating Calculator Results
When comparing annuity calculator results, focus on these key metrics:
| Metric | What It Tells You | How to Evaluate |
| Total Accumulated Value | The projected future value of your investment | Compare across different annuity types and interest rates |
| Monthly Income Amount | How much regular income you’ll receive | Determine if it meets your income needs and compare to other income sources |
| Total Return on Investment | How much your investment grows over time | Compare to other retirement vehicles like 401(k)s or IRAs |
| Income Duration | How long payments will continue | Consider your life expectancy and income needs |
| Inflation-Adjusted Value | The real purchasing power of future payments | Look for options that maintain purchasing power over time |
Balancing Annuities with Other Retirement Vehicles
Annuities should typically be part of a diversified retirement strategy, not your only investment. Consider how annuities complement other retirement vehicles:
- Social Security – Provides a baseline of guaranteed income
- 401(k)s and IRAs – Offer tax advantages and growth potential
- Pensions – Provide guaranteed income similar to annuities
- Traditional investments – Stocks, bonds, and mutual funds for growth and liquidity
The ideal annuity isn’t necessarily the one with the highest projected return, but the one that best addresses your specific retirement needs while balancing security and growth potential.
Compare Annuity Options Based on Your Needs
Use our calculator to see how different annuity types might perform for your specific financial situation.
Common Mistakes to Avoid When Using Annuity Calculators
Even the best annuity calculator can lead to misleading results if used incorrectly. Here are common mistakes to avoid when calculating potential annuity returns.

Unrealistic Expectations
- Using overly optimistic interest rates – Assuming higher-than-realistic returns can lead to disappointment
- Ignoring market volatility – Especially important for variable and indexed annuities
- Overlooking inflation – Not accounting for how inflation reduces purchasing power over time
Incomplete Inputs
- Forgetting to include fees – Administrative fees, mortality expenses, and rider charges can significantly impact returns
- Ignoring surrender charges – Early withdrawal penalties can substantially reduce your returns
- Overlooking tax implications – Not accounting for how taxes will affect your net income
Misinterpreting Results
- Focusing only on total returns – Without considering liquidity needs and access to funds
- Not comparing different scenarios – Failing to explore how changing inputs affects outcomes
- Overlooking the time value of money – Not recognizing that future dollars have less purchasing power
Warning: Remember that calculator results are projections based on current information, not guarantees of future performance. Always consult with a financial advisor before making significant investment decisions.
Best Practices for Accurate Calculations
- Use conservative estimates – Especially for interest rates and market returns
- Include all fees and charges – Research typical fees for the annuity type you’re considering
- Account for inflation – Use an inflation-adjusted calculation when possible
- Compare multiple scenarios – Test different inputs to understand potential outcomes
- Verify with multiple calculators – Cross-check results using different tools
Frequently Asked Questions About Annuities and Calculations
What is the difference between an annuity calculator and a retirement calculator?
An annuity calculator specifically focuses on projecting returns and income from annuity products, while a retirement calculator takes a broader approach to estimate overall retirement savings needs and income from multiple sources. Annuity calculators are more specialized tools for evaluating specific annuity products and their potential returns.
How accurate are annuity calculator results?
Annuity calculator results are estimates based on the information you provide and current market conditions. Their accuracy depends on the quality of your inputs and the calculator’s underlying assumptions. For fixed annuities, results tend to be more accurate since the interest rate is guaranteed. For variable and indexed annuities, results are less certain due to market fluctuations.
Can I use an annuity calculator to compare different annuity providers?
Yes, but with limitations. An annuity calculator can help you compare potential returns based on different interest rates and fee structures offered by various providers. However, you’ll need to input the specific terms from each provider to get accurate comparisons. Remember to also consider factors like the financial strength of the insurance company and contract features that may not be reflected in calculator results.
How do taxes affect annuity calculations?
Most annuity calculators show pre-tax results. Annuity payments are typically subject to ordinary income tax on the portion representing earnings (not your original principal). For non-qualified annuities (purchased with after-tax dollars), only the earnings portion is taxable. For qualified annuities (purchased with pre-tax dollars, like from an IRA), the entire payment is usually taxable. Some advanced calculators allow you to input your tax rate to see after-tax income.
What information do I need before using an annuity calculator?
To get the most accurate results, gather information about your initial investment amount, any planned additional contributions, your age, desired retirement age, expected interest rate or return, and the type of annuity you’re considering. If comparing specific products, also collect information about fees, surrender charges, and any special features or riders.
Should I rely solely on an annuity calculator when making investment decisions?
No, annuity calculators should be used as one tool in your decision-making process, not the sole determinant. While they provide valuable projections, they can’t account for all variables affecting your financial future. It’s advisable to consult with a financial advisor who can provide personalized guidance based on your complete financial situation and goals.

Conclusion: Making Informed Annuity Decisions
Annuity calculators are powerful tools that can help you navigate the complex world of retirement planning. By providing estimates of future income and accumulated value, they allow you to compare different annuity options and make decisions aligned with your financial goals.
Remember that the most effective retirement strategy often involves a diversified approach. Annuities can provide valuable income security, but they work best when complemented by other investment vehicles that offer growth potential and liquidity.
As you use our annuity calculator, focus on realistic inputs, consider multiple scenarios, and interpret results in the context of your overall financial plan. While calculators provide valuable insights, they’re most effective when paired with professional financial advice tailored to your specific situation.
Ready to Calculate Your Retirement Income?
Use our comprehensive annuity calculator to estimate your future income and take control of your retirement planning today.
Whether you’re just starting to explore annuities or are ready to make an investment decision, our calculator and educational resources are designed to help you navigate each step with confidence. Your financial future deserves careful planning—and we’re here to help you make the most informed decisions possible.