Use our Annuity Payout Calculator to estimate periodic payments from your annuity. Plan retirement income and manage your financial future confidently.
Planning for retirement requires careful consideration of how your savings will translate into reliable income. An annuity payout calculator helps you estimate the regular payments you could receive from an annuity investment, providing clarity for your long-term financial planning. Whether you’re exploring fixed, variable, or indexed annuities, understanding how these calculations work is essential for making informed decisions about your retirement strategy.
This comprehensive guide will walk you through everything you need to know about annuity payout calculators, how they work, and how to use them effectively to plan your financial future with confidence.
What Is an Annuity Payout Calculator?
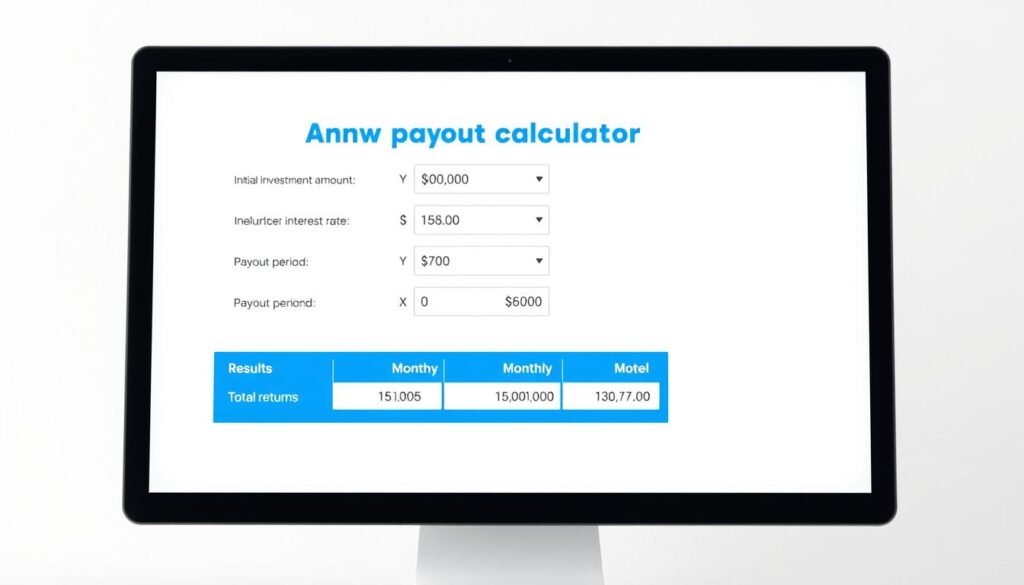
An annuity payout calculator helps estimate your regular income payments based on your investment amount and terms.
An annuity payout calculator is a financial tool designed to estimate how much regular income you can expect to receive from an annuity contract. Unlike the accumulation phase calculator (which shows how your annuity grows over time), a payout calculator focuses specifically on the distribution phase – when you’re receiving payments from your annuity investment.
These calculators help answer critical questions such as:
- How much monthly income can I expect from my annuity?
- How long will my annuity payments last?
- What factors affect my annuity payout amount?
- How do different payout options compare?
By inputting variables like your initial investment, interest rate, and desired payout period, you can get a clearer picture of your potential retirement income stream. This information is invaluable for retirement planning, helping you determine if an annuity aligns with your financial goals.
How Annuity Payouts Work
Before diving into calculator specifics, it’s important to understand the fundamental mechanics of annuity payouts. Annuities transition from the accumulation phase (when you’re contributing money) to the payout phase (when you’re receiving income) through a process called annuitization.
The Annuitization Process
Annuitization is the point at which your accumulated annuity value is converted into a stream of regular payments. This marks the transition from growing your investment to receiving income from it. Once annuitized, the decision is typically irreversible, making it crucial to understand your options beforehand.
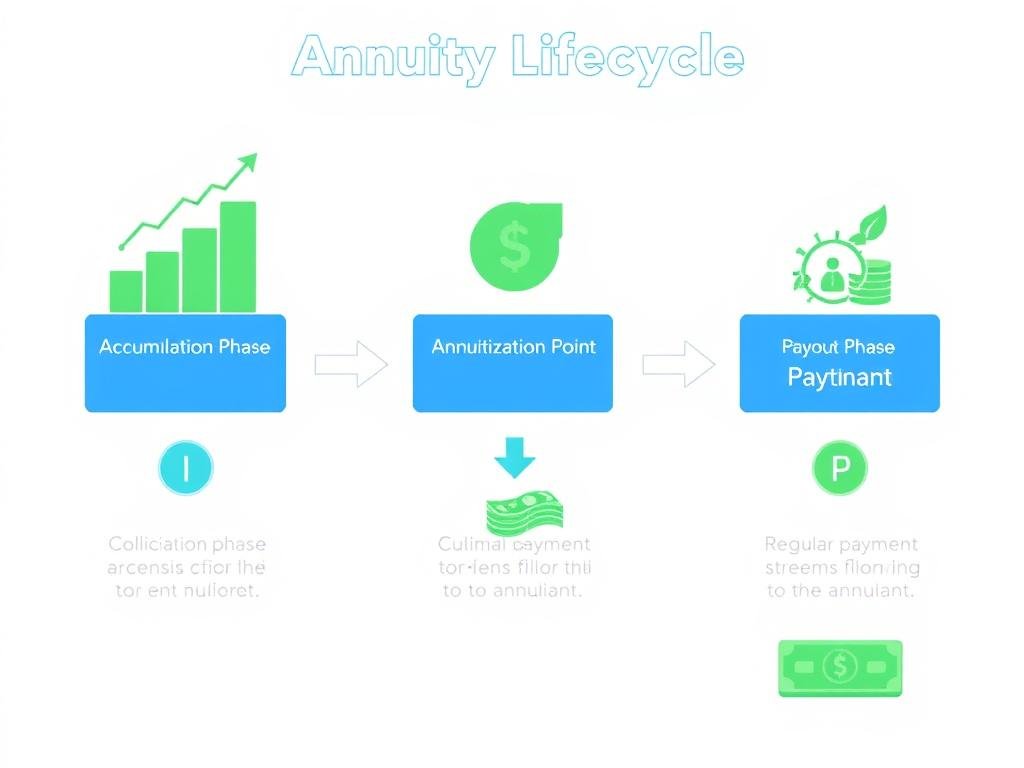
The annuity lifecycle: from accumulation through annuitization to the payout phase.
Key Factors Affecting Annuity Payouts
Several critical factors determine how much you’ll receive in annuity payments:
Principal Investment
The amount you initially invest or accumulate in your annuity directly impacts your payment size. Larger investments generally yield larger payments.
Interest Rate
The rate of return on your annuity significantly affects payout amounts. Higher interest rates result in larger payments, while lower rates reduce payment size.
Age and Life Expectancy
For lifetime annuities, your age at the time of annuitization is crucial. Older individuals typically receive larger payments because the insurer expects to make payments for fewer years.
Payout Period
Whether you choose lifetime payments or a fixed period affects your payment amount. Shorter payout periods generally result in larger individual payments.
Payment Frequency
How often you receive payments (monthly, quarterly, annually) affects the individual payment amount. Less frequent payments are typically larger.
Annuity Type
Fixed, variable, or indexed annuities each have different payout structures and potential payment amounts based on their underlying investment approach.
Types of Annuities and Their Payout Calculations
Different types of annuities offer varying approaches to generating retirement income. Understanding these differences is essential for using an annuity payout calculator effectively.
Fixed Annuities
Fixed annuities provide guaranteed, predictable payments based on a fixed interest rate determined when you purchase the contract. The calculation for fixed annuity payouts is relatively straightforward:
Fixed Annuity Payout Formula:
Payment = Principal × (Interest Rate Factor ÷ Payment Periods Per Year)
Where the Interest Rate Factor is determined by the insurance company based on current interest rates, your age, and the payout period.
Fixed annuities are ideal for retirees seeking stable, predictable income without market risk. However, they offer limited growth potential compared to other annuity types.
Variable Annuities
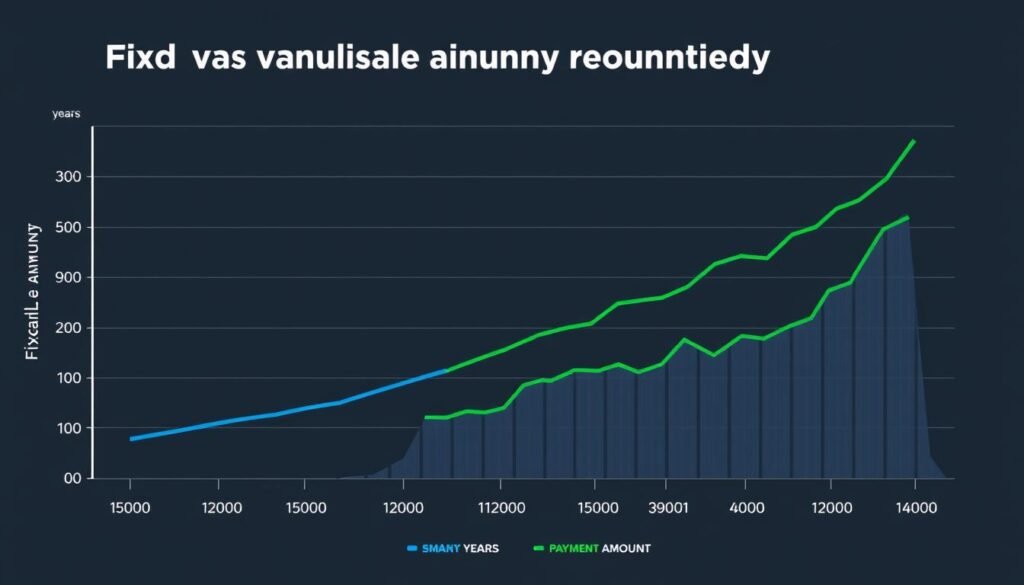
Comparison of fixed vs. variable annuity payouts showing potential fluctuations in variable annuity payments.
Variable annuities tie your payments to the performance of underlying investment options, typically mutual funds. This means your payout can fluctuate based on market performance:
Variable Annuity Payout Calculation:
Initial Payment = Account Value ÷ Annuity Factor
Future payments adjust based on the performance of your chosen investments relative to the assumed interest rate.
Variable annuities offer growth potential that can help combat inflation, but they come with market risk and typically higher fees than fixed annuities.
Indexed Annuities
Indexed annuities provide a middle ground, with payouts linked to a market index (like the S&P 500) but with downside protection:
Indexed Annuity Payout Calculation:
Payment = Principal × (Index-Linked Return Rate Factor ÷ Payment Periods)
Returns are typically subject to caps, participation rates, and floors that limit both potential gains and losses.
Indexed annuities can offer higher returns than fixed annuities while providing more stability than variable options, making them attractive for balanced retirement planning.
How to Use an Annuity Payout Calculator
Using an annuity payout calculator effectively requires understanding the input variables and how they affect your results. Here’s a step-by-step guide to getting the most accurate estimates:
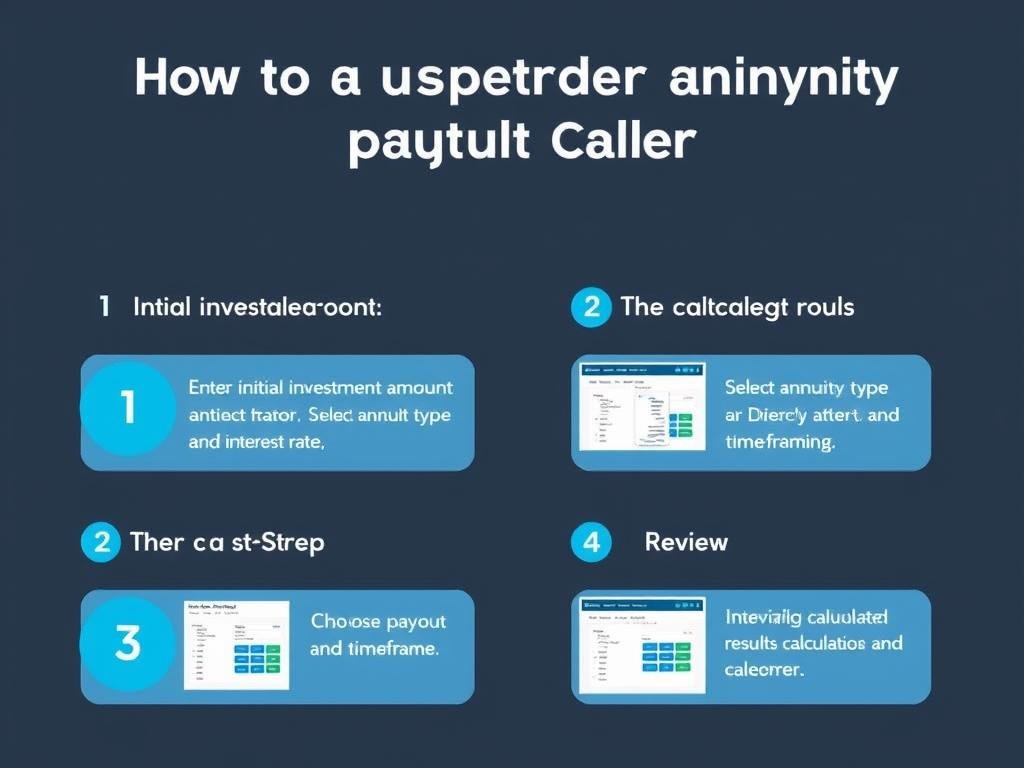
Follow these steps to effectively use an annuity payout calculator for retirement planning.
Step 1: Gather Your Information
Before using a calculator, collect the following information:
- Initial investment or current annuity value
- Your age (and your spouse’s age for joint annuities)
- Desired payment frequency (monthly, quarterly, annually)
- Expected interest rate or return
- Preferred payout period or option
Step 2: Enter Your Initial Investment
Input the amount you plan to invest in the annuity or the current value of your existing annuity. This is the principal amount that will generate your income stream.
Step 3: Select Your Annuity Type and Terms
Choose between fixed, variable, or indexed annuity options if available. Enter the expected interest rate or return based on current market conditions and the type of annuity you’re considering.
Step 4: Choose Your Payout Option
Select your preferred payout structure:
- Fixed Period: Payments for a specific number of years
- Lifetime: Payments for as long as you live
- Joint Life: Payments for as long as either you or your spouse lives
- Life with Period Certain: Guaranteed payments for a minimum period, then continuing for life
Step 5: Review and Adjust Your Results
After calculating your estimated payout, consider running multiple scenarios with different variables to compare outcomes. This helps you understand how changes to your investment amount, interest rate, or payout option affect your potential income.
Ready to Calculate Your Potential Annuity Income?
Use our free annuity payout calculator to estimate your retirement income based on your specific situation and goals.
Annuity Payout Options Compared
The payout option you choose significantly impacts both the amount you’ll receive and the security it provides. Let’s compare the most common options:
| Payout Option | Payment Amount | Duration | Beneficiary Protection | Best For |
| Lump Sum | Entire balance at once | One-time payment | None | Immediate large expenses or reinvestment |
| Fixed Period | Higher than lifetime | Specific number of years | Remaining payments if death occurs during period | Known time horizon needs |
| Lifetime Income | Moderate | Until death | None without riders | Longevity protection |
| Joint Life | Lower than single life | Until both annuitants die | Surviving spouse protected | Married couples |
| Life with Period Certain | Lower than lifetime only | Lifetime with minimum guaranteed period | Payments continue to beneficiary if death occurs during period certain | Balance of lifetime income and legacy planning |
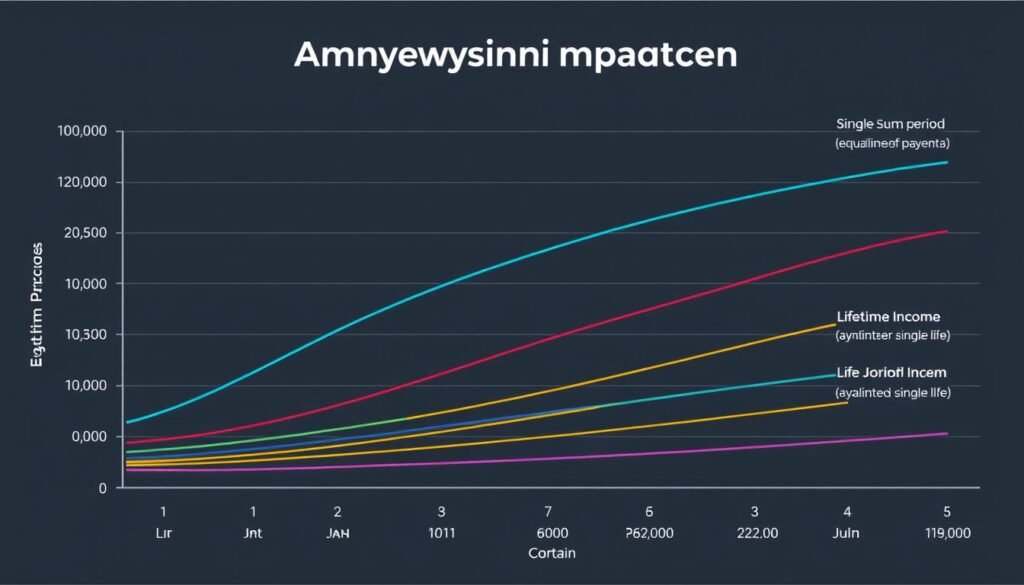
Visual comparison of how different annuity payout options distribute payments over time.
Selecting the Right Payout Option
When choosing a payout option, consider these key factors:
Income Needs
How much regular income do you need to supplement other retirement sources like Social Security or pensions?
Life Expectancy
Consider your family history, current health, and lifestyle when estimating how long you might need income.
Legacy Goals
If leaving money to heirs is important, options with death benefits or period certain guarantees may be preferable.
Inflation Concerns
Consider whether fixed payments will maintain purchasing power over a potentially long retirement.
Tax Implications of Annuity Payouts
Understanding the tax treatment of annuity payments is crucial for accurate retirement planning. The tax implications vary based on several factors:
Qualified vs. Non-Qualified Annuities
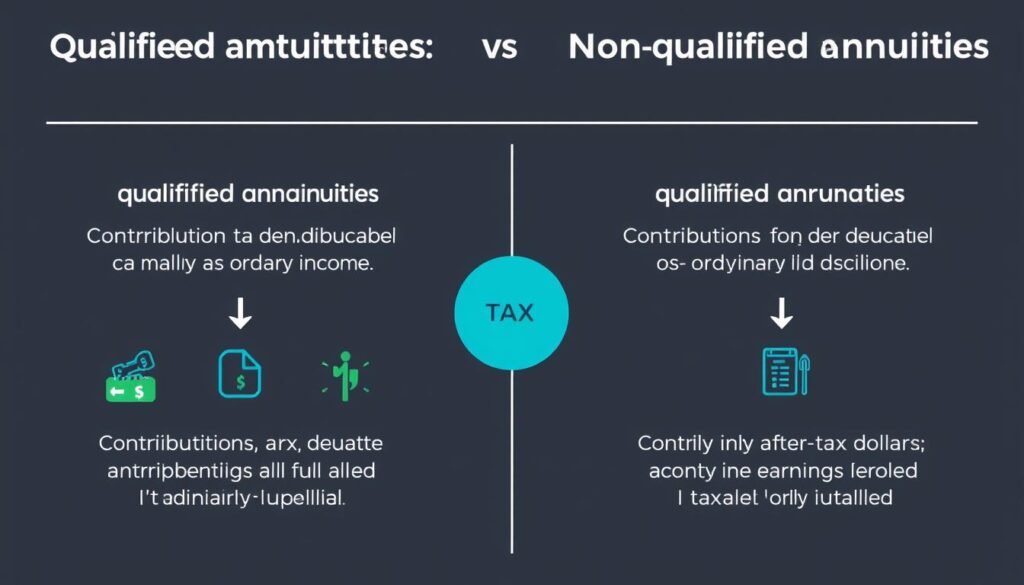
Tax treatment comparison between qualified and non-qualified annuities.
Qualified Annuities
Annuities purchased with pre-tax dollars (such as through an IRA or 401(k)) are considered qualified. The entire payment amount is typically taxed as ordinary income when received, as no taxes were paid on the original contributions.
Non-Qualified Annuities
Annuities purchased with after-tax dollars are non-qualified. Only the earnings portion of each payment is taxable, while the return of your principal is tax-free. This is calculated using an exclusion ratio based on your life expectancy.
Exclusion Ratio for Non-Qualified Annuities
The exclusion ratio determines what portion of each payment is considered a return of principal (tax-free) versus earnings (taxable):
Exclusion Ratio = Investment in Contract ÷ Expected Return
This ratio is then applied to each payment to determine the tax-free portion.
Early Withdrawal Penalties
Withdrawals from an annuity before age 59½ may incur a 10% IRS early withdrawal penalty in addition to regular income tax. This penalty applies to the taxable portion of the withdrawal.
Important: Tax rules for annuities are complex and subject to change. Consult with a qualified tax professional before making decisions about annuity purchases or withdrawals.
Common Mistakes to Avoid When Using Annuity Payout Calculators
While annuity payout calculators are valuable tools, they’re only as accurate as the information you provide. Avoid these common pitfalls:

Be aware of these common mistakes when using annuity payout calculators for retirement planning.
Best Practices
- Use current, realistic interest rates
- Account for inflation in long-term planning
- Include all fees and expenses
- Consider your actual life expectancy based on health and family history
- Run multiple scenarios with different variables
- Update calculations periodically as circumstances change
Common Mistakes
- Using outdated or unrealistic interest rates
- Ignoring the impact of inflation on fixed payments
- Forgetting to account for fees and expenses
- Underestimating life expectancy
- Failing to consider tax implications
- Not reassessing as financial conditions change
Overcoming Calculator Limitations
Remember that calculators have inherent limitations:
- They provide estimates, not guarantees
- They may not account for all variables affecting real-world payouts
- They typically don’t factor in economic changes or insurance company stability
To get the most accurate picture, use calculators as a starting point, then consult with a financial advisor who can provide personalized guidance based on your complete financial situation.
How Annuity Calculators Support Retirement Planning
Annuity payout calculators play a crucial role in comprehensive retirement planning by helping you:
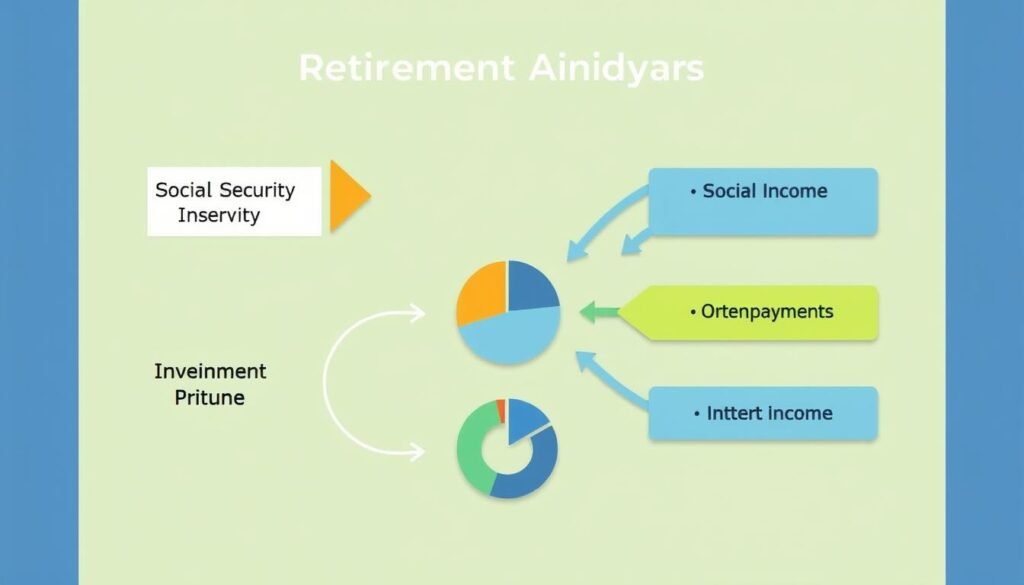
How annuity income fits into a comprehensive retirement income strategy.
Create a Reliable Income Floor
Annuities can provide a dependable income base to cover essential expenses, complementing Social Security and pension benefits. Calculators help you determine how much to allocate to annuities versus other investments to create this income floor.
Address Longevity Risk
One of the biggest retirement planning challenges is ensuring you don’t outlive your savings. Lifetime annuity payments provide insurance against this risk, and calculators help quantify how much lifetime income you can secure with different investment amounts.
Balance Growth and Security
Retirement portfolios typically need both growth potential and income security. Annuity calculators help you determine the optimal allocation between guaranteed annuity income and market-based investments to balance these competing needs.
Plan for Different Retirement Phases
Many retirees have different income needs during early, middle, and late retirement. Calculators can help model how deferred annuities or varying payout structures might address changing needs throughout retirement.
Need Help Planning Your Retirement Income Strategy?
Speak with a retirement specialist who can help you determine if annuities should be part of your financial plan.
Frequently Asked Questions About Annuity Payout Calculations
How much does a 0,000 annuity pay per month?
The monthly payment from a 0,000 annuity varies based on several factors, including your age, gender, current interest rates, and the payout option selected. As a general estimate, a 65-year-old might receive between 0-0 monthly for a lifetime income annuity. For a 10-year period certain annuity, payments might range from 0-
Frequently Asked Questions About Annuity Payout Calculations
How much does a $100,000 annuity pay per month?
The monthly payment from a $100,000 annuity varies based on several factors, including your age, gender, current interest rates, and the payout option selected. As a general estimate, a 65-year-old might receive between $450-$600 monthly for a lifetime income annuity. For a 10-year period certain annuity, payments might range from $900-$1,100 monthly. Use an annuity payout calculator with your specific details for a more accurate estimate.
What happens to my annuity payments if I die?
What happens depends on your chosen payout option. With a straight life annuity, payments stop at death with no further benefits. With a life with period certain option, payments continue to your beneficiary if you die within the guaranteed period. Joint life annuities continue payments to your surviving spouse or partner. Some annuities also offer death benefit riders for additional protection.
Can I change my annuity payout option after annuitization?
Generally, no. Once an annuity is annuitized and begins making payments, the payout option cannot be changed. This is why it’s crucial to carefully consider your options before annuitization. Some annuity contracts offer limited liquidity options or commutation rights, but these typically come with significant penalties or reductions in future payments.
How do inflation and cost-of-living affect annuity payouts?
Standard fixed annuities provide the same payment amount for life, which means inflation will erode purchasing power over time. Some annuities offer cost-of-living adjustment (COLA) riders that increase payments annually, typically by 1-5%. While these riders provide inflation protection, they result in lower initial payments. Variable and indexed annuities may provide some natural inflation protection through potential payment increases, but without guarantees.
Are annuity payout calculators accurate?
Annuity payout calculators provide reasonable estimates based on the information you input, but actual payouts will vary based on the specific terms offered by insurance companies. Factors like current interest rates, your exact age at purchase, fees, and company-specific mortality tables all affect final payout amounts. Use calculators as planning tools, but get quotes from actual insurance providers before making decisions.

Consulting with a financial advisor can help you understand your annuity options and make informed decisions.
,100 monthly. Use an annuity payout calculator with your specific details for a more accurate estimate.
What happens to my annuity payments if I die?
What happens depends on your chosen payout option. With a straight life annuity, payments stop at death with no further benefits. With a life with period certain option, payments continue to your beneficiary if you die within the guaranteed period. Joint life annuities continue payments to your surviving spouse or partner. Some annuities also offer death benefit riders for additional protection.
Can I change my annuity payout option after annuitization?
Generally, no. Once an annuity is annuitized and begins making payments, the payout option cannot be changed. This is why it’s crucial to carefully consider your options before annuitization. Some annuity contracts offer limited liquidity options or commutation rights, but these typically come with significant penalties or reductions in future payments.
How do inflation and cost-of-living affect annuity payouts?
Standard fixed annuities provide the same payment amount for life, which means inflation will erode purchasing power over time. Some annuities offer cost-of-living adjustment (COLA) riders that increase payments annually, typically by 1-5%. While these riders provide inflation protection, they result in lower initial payments. Variable and indexed annuities may provide some natural inflation protection through potential payment increases, but without guarantees.
Are annuity payout calculators accurate?
Annuity payout calculators provide reasonable estimates based on the information you input, but actual payouts will vary based on the specific terms offered by insurance companies. Factors like current interest rates, your exact age at purchase, fees, and company-specific mortality tables all affect final payout amounts. Use calculators as planning tools, but get quotes from actual insurance providers before making decisions.

Consulting with a financial advisor can help you understand your annuity options and make informed decisions.
Making Informed Decisions with Annuity Payout Calculators
Annuity payout calculators are powerful tools that can help you navigate the complex world of retirement income planning. By understanding how these calculators work and the factors that influence annuity payouts, you can make more informed decisions about whether annuities should be part of your retirement strategy.
Remember that while calculators provide valuable estimates, they’re just one part of a comprehensive retirement planning process. Consider working with a qualified financial advisor who can help you evaluate annuity options in the context of your overall financial situation, goals, and needs.
Whether you’re looking for guaranteed lifetime income, protection for a spouse, or a specific payment period, understanding annuity payout calculations empowers you to choose the right options for your unique retirement journey.
Ready to Calculate Your Potential Annuity Income?
Use our comprehensive annuity payout calculator to see how different options could affect your retirement income.