Use our Average Return Calculator to estimate the average growth of your investments over time. Plan contributions and assess financial performance effectively.
Making informed investment decisions requires a clear understanding of how your investments perform over time. An average return calculator helps you accurately measure and compare the performance of different investments, giving you the insights needed to optimize your portfolio. Whether you’re evaluating stocks, bonds, mutual funds, or real estate investments, calculating the average return is essential for assessing risk and potential rewards.
Average Return Calculator
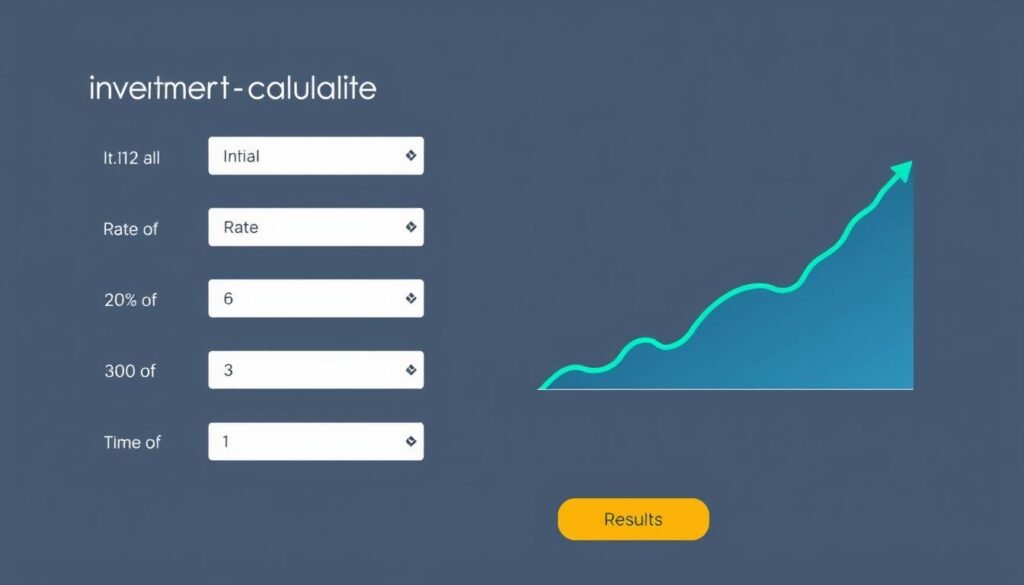
Use our free calculator to determine the average return on your investments. Enter your initial investment amount, additional contributions, expected rate of return, and investment timeframe to see potential growth.
What is an Average Return Calculator?
An average return calculator is a financial tool that helps investors determine the potential growth of their investments over time. By analyzing historical data and applying mathematical formulas, these calculators provide insights into how your money might grow based on different rates of return.
Understanding your average return is crucial because it allows you to:
While past performance doesn’t guarantee future results, calculating average returns provides a valuable framework for evaluating investment options and planning your financial future.

Types of Average Return Calculations
There are several methods for calculating average returns, each with specific applications and limitations. Understanding the differences between these methods is essential for choosing the right approach for your investment analysis.
Arithmetic Mean Return
The arithmetic mean is the simplest form of average return calculation. It adds all the periodic returns and divides by the number of periods.
Formula: Arithmetic Mean Return = (R₁ + R₂ + … + Rₙ) / n
Where R represents the return for each period and n is the number of periods.
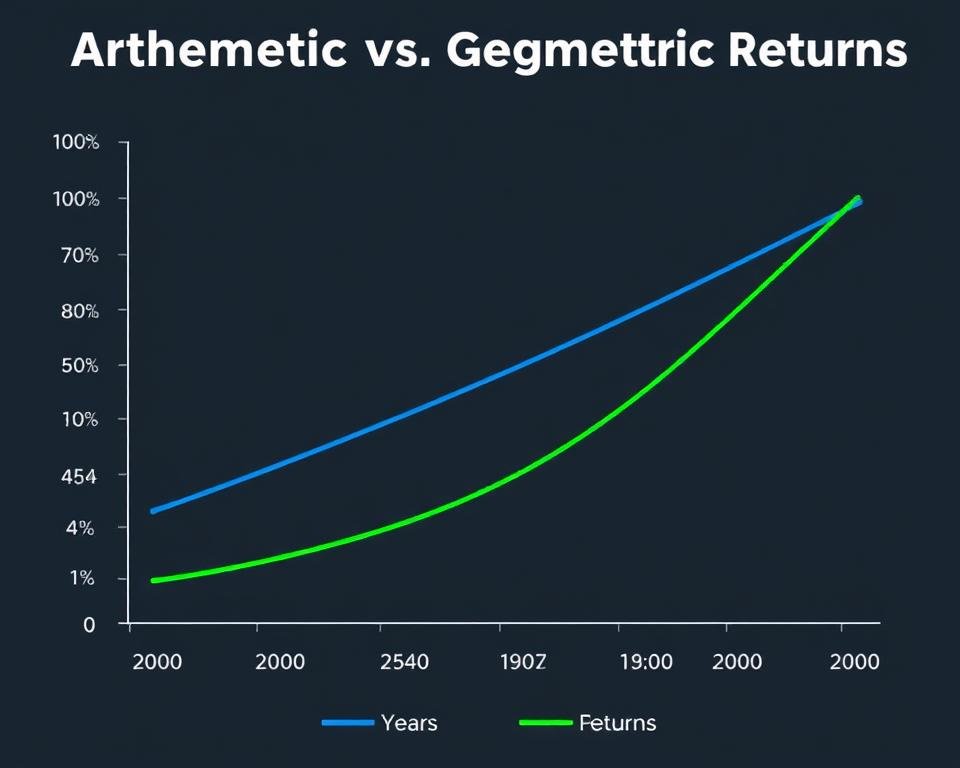
While easy to calculate, the arithmetic mean can overstate long-term performance because it doesn’t account for the compounding effect of returns over time.
Need to calculate your arithmetic mean return? Our calculator handles the math for you.
Geometric Mean Return
The geometric mean provides a more accurate representation of actual investment performance over time because it accounts for compounding effects.
Formula: Geometric Mean Return = [(1 + R₁) × (1 + R₂) × … × (1 + Rₙ)]^(1/n) – 1
Where R represents the return for each period and n is the number of periods.
The geometric mean is always less than or equal to the arithmetic mean, providing a more conservative and realistic estimate of long-term investment performance.
Time-Weighted Return
Time-weighted return measures the compound rate of growth in a portfolio, eliminating the distorting effects of cash flows (deposits or withdrawals).
This method is particularly useful for evaluating investment manager performance since it isolates the effects of market movements from the impact of investor contributions or withdrawals.
Compare different return calculation methods with our comprehensive calculator.
Money-Weighted Return (Internal Rate of Return)
The money-weighted return, also known as the internal rate of return (IRR), accounts for the timing and amount of all cash flows into and out of an investment.
This method is particularly useful for individual investors who want to understand how their specific contribution and withdrawal patterns have affected their overall returns.
How to Calculate Average Return: Step-by-Step Guide
Calculating average returns accurately requires following specific steps based on the method you choose. Here’s a practical guide to help you understand the process:
Calculating Arithmetic Mean Return
Example: If your investment returned 10%, -5%, 8%, and 7% over four years, the arithmetic mean would be (10% + (-5%) + 8% + 7%) ÷ 4 = 5%
Calculating Geometric Mean Return
Example: Using the same returns as above: [(1.10) × (0.95) × (1.08) × (1.07)]^(1/4) – 1 = 4.85%

Using Our Average Return Calculator
While manual calculations are educational, our average return calculator simplifies the process:
Save time and ensure accuracy with our easy-to-use calculator.
Practical Examples of Average Return Calculations
Understanding average returns becomes clearer with real-world examples. Let’s examine how different investment scenarios play out using various calculation methods.
Example 1: Stock Investment
Imagine you invested $10,000 in a stock that generated the following annual returns:
| Year | Annual Return | Portfolio Value |
| 1 | 12% | $11,200 |
| 2 | -8% | $10,304 |
| 3 | 15% | $11,850 |
| 4 | 9% | $12,916 |
| 5 | 7% | $13,820 |
Arithmetic Mean:
(12% + (-8%) + 15% + 9% + 7%) ÷ 5 = 7%
Geometric Mean:
[(1.12) × (0.92) × (1.15) × (1.09) × (1.07)]^(1/5) – 1 = 6.69%
Notice how the arithmetic mean slightly overstates the actual annualized return compared to the geometric mean, which better reflects the true growth rate of your investment.
Example 2: Mutual Fund with Regular Contributions
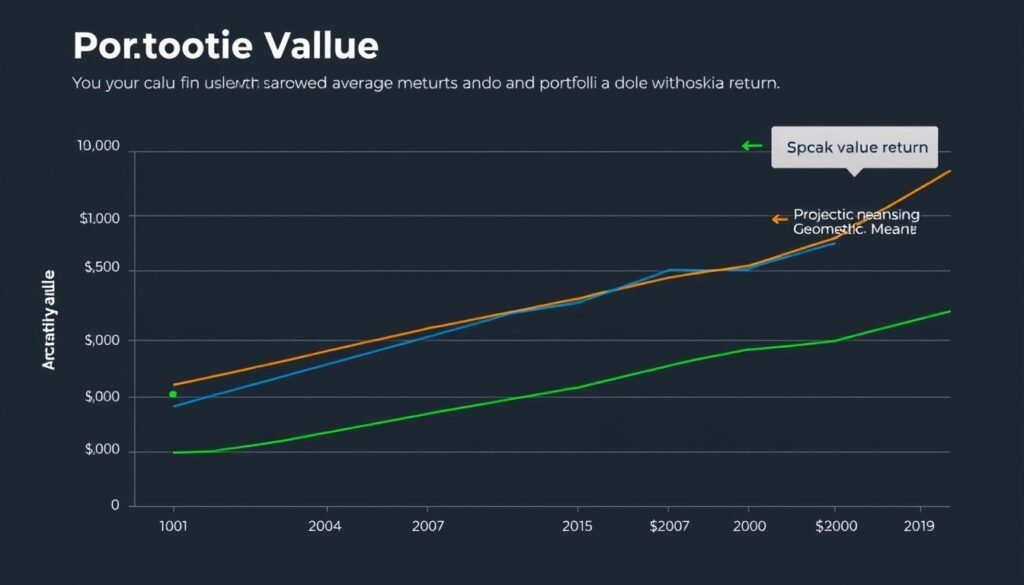
Consider a scenario where you invest $5,000 initially in a mutual fund and contribute an additional $200 monthly over 3 years:
With an average annual return of 8% (geometric mean), your investment would grow to approximately $14,770 after 3 years.
This includes your initial $5,000, plus $7,200 in contributions ($200 × 36 months), and about $2,570 in investment returns.
This example demonstrates how regular contributions significantly impact your investment growth compared to a one-time investment.
See how regular contributions can accelerate your investment growth.
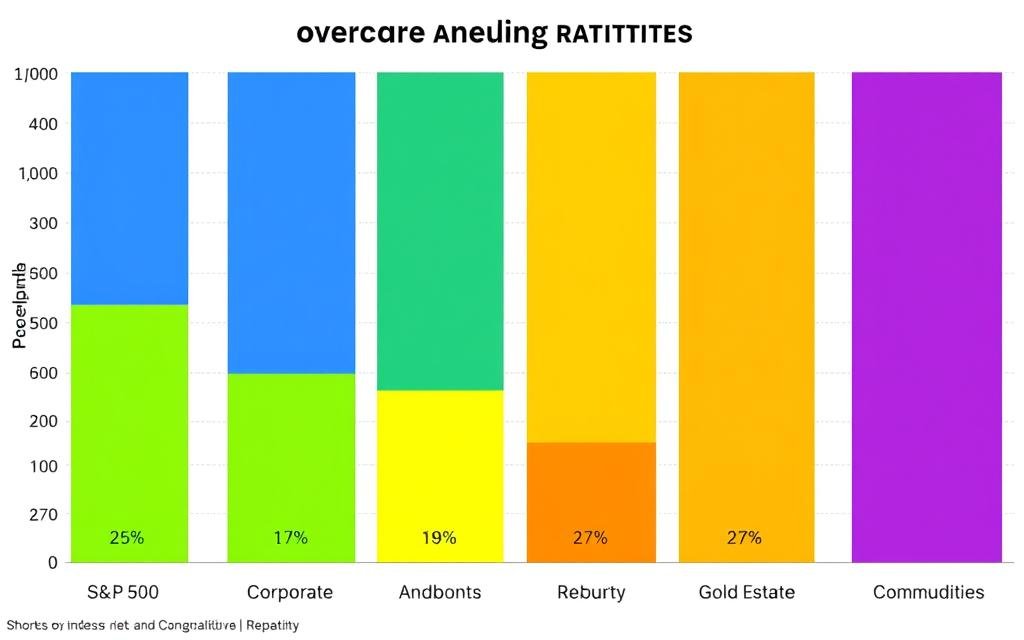
Average Returns Across Different Investment Types
Different investment vehicles have historically delivered varying average returns. Understanding these patterns can help you set realistic expectations and make informed investment decisions.
| Investment Type | Historical Average Annual Return | Risk Level | Typical Time Horizon |
| S&P 500 Index | 10.5% (since 1957) | Moderate to High | 5+ years |
| Corporate Bonds | 3-6% | Low to Moderate | 2-10 years |
| Government Bonds | 2-4% | Low | 1-30 years |
| Real Estate | 5-7% | Moderate | 5-20 years |
| Gold & Commodities | 2-8% | High | 5+ years |
Remember that these figures represent long-term historical averages. Actual returns can vary significantly in any given year or period. The S&P 500, for instance, has experienced years with returns exceeding 30% and others with losses greater than 20%.
Impact of Time Horizon on Average Returns
The length of your investment period significantly affects the reliability of average return calculations. Longer time horizons tend to smooth out market volatility and provide more predictable average returns.
Short-Term (1-3 years)
Short-term average returns can be highly volatile and may not reflect long-term trends. Market fluctuations can significantly impact performance over brief periods.
Long-Term (10+ years)
Long-term average returns typically provide a more reliable indicator of investment performance, as they capture multiple market cycles and economic conditions.
Analyze how different time horizons affect your investment returns.
Common Mistakes When Calculating Average Returns
Accurately calculating average returns requires avoiding several common pitfalls that can lead to misleading results.
Best Practices
Common Mistakes

Important: When comparing investments, ensure you’re using the same calculation method for all. Mixing arithmetic and geometric means can lead to incorrect conclusions about relative performance.
Benefits of Using an Average Return Calculator
Incorporating an average return calculator into your investment planning process offers numerous advantages:
Informed Decision Making
Compare different investment opportunities based on projected returns, helping you allocate your resources more effectively.
Goal Setting
Determine how much you need to invest and at what rate of return to reach specific financial goals within your desired timeframe.
Risk Assessment
Evaluate the relationship between potential returns and investment risk, allowing for better portfolio construction.
Performance Tracking
Monitor your investments against projected returns and make adjustments to your strategy as needed.
Retirement Planning
Project how your retirement savings will grow over time based on different contribution and return scenarios.
Educational Value
Gain a deeper understanding of how different factors impact investment performance over time.

“The best investment you can make is in your own financial education. Understanding how to calculate and interpret average returns is fundamental to successful investing.”
Make Better Investment Decisions with Our Average Return Calculator
Understanding and accurately calculating average returns is essential for making informed investment decisions. Our average return calculator simplifies this process, providing you with the insights needed to evaluate investment opportunities, track performance, and plan for your financial future.
Whether you’re comparing different investment options, planning for retirement, or simply trying to understand how your current investments are performing, our calculator offers the flexibility and accuracy you need.
Start Calculating Your Investment Returns Today
Take control of your financial future with our free, easy-to-use average return calculator.
Remember that while average return calculations provide valuable insights, they represent historical or projected performance and cannot guarantee future results. Always consider your personal financial situation, risk tolerance, and investment goals when making investment decisions.
Frequently Asked Questions About Average Returns
What’s the difference between average return and total return?
Average return represents the mean performance over multiple time periods, while total return measures the overall gain or loss on an investment over its entire holding period, including both price appreciation and income (such as dividends or interest).
Why is the geometric mean usually lower than the arithmetic mean?
The geometric mean accounts for the compounding effect of returns over time, which means negative returns have a proportionally larger impact than positive returns of the same magnitude. This mathematical reality typically results in a geometric mean that’s lower than the arithmetic mean for the same set of returns.
How do fees affect my average return calculations?
Investment fees directly reduce your returns. For example, if your investments earn an 8% average annual return but you pay 1% in fees, your net return is only 7%. Over time, this difference can significantly impact your investment growth due to compounding. Our calculator allows you to account for fees in your return projections.
Should I use average returns for short-term investment decisions?
Average returns are most useful for long-term planning. For short-term decisions, it’s often better to consider specific market conditions, current trends, and your immediate financial needs rather than relying solely on historical average returns.
How often should I recalculate my investment returns?
Most financial advisors recommend reviewing your investment performance quarterly or semi-annually, with a more comprehensive analysis annually. However, avoid making major investment decisions based on short-term fluctuations in returns.
