Confidence Interval Calculator helps you compute intervals for population mean or proportion. Fast, accurate, and ideal for statistics and data analysis.
Confidence Interval Calculator
In the world of statistics and data analysis, confidence intervals play a crucial role in estimating population parameters from sample data. Whether you're a student, researcher, or professional analyst, understanding how to calculate and interpret confidence intervals is essential for making informed decisions based on statistical data. Our Confidence Interval Calculator simplifies this complex process, providing accurate results without the need for manual calculations.
What is a Confidence Interval?
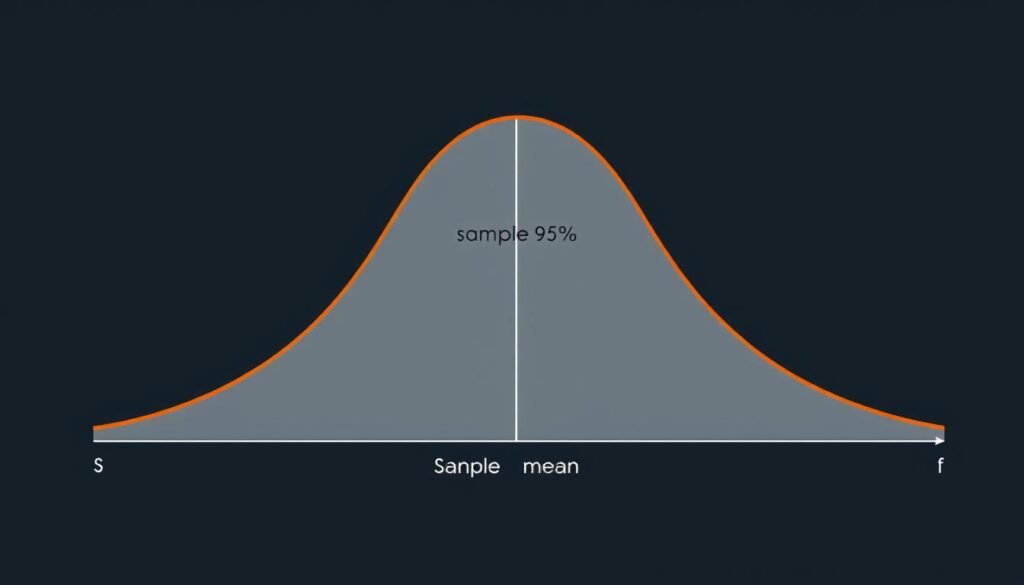
A confidence interval is a range of values that likely contains an unknown population parameter. Instead of estimating the parameter with a single value, a confidence interval provides a range of possible values with a specified probability that the true parameter lies within that range.
Think of it this way: If you're measuring the average height of all adults in a country, it would be impractical to measure everyone. Instead, you might measure a sample of 1,000 people and find their average height is 5'9". But how close is this to the true average? A confidence interval gives you a range, such as 5'8.5" to 5'9.5", with a certain confidence level (commonly 95%) that the true population average falls within this range.
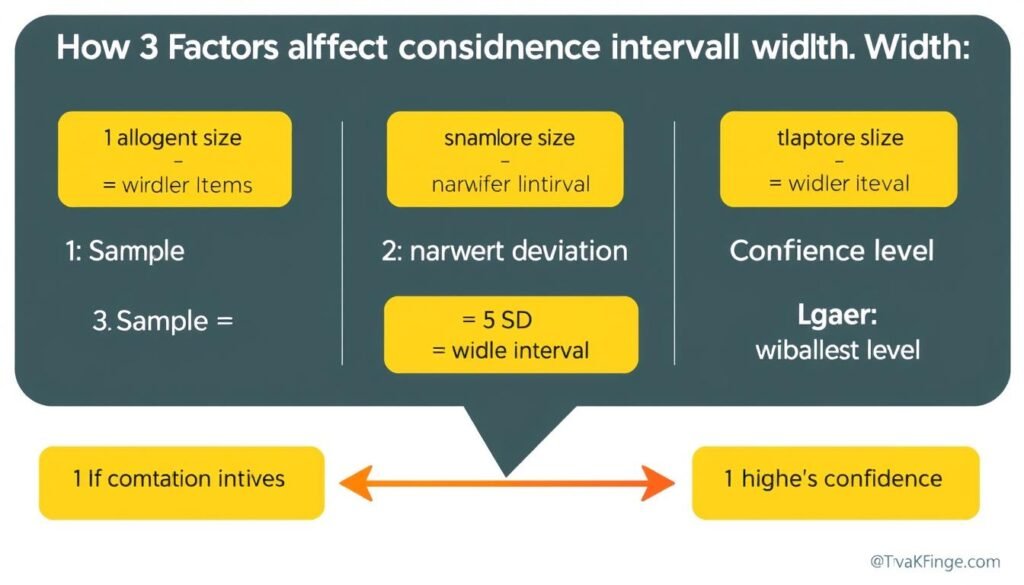
The width of a confidence interval reveals the precision of your estimate – narrower intervals indicate more precise estimates. This width is influenced by three key factors: sample size, variability in the data, and the chosen confidence level.
Key Components of a Confidence Interval
Sample Mean (x̄)
The sample mean is the average value of your sample data. It serves as the central point of your confidence interval and represents your best estimate of the population mean based on your sample.
Standard Deviation (σ or s)
The standard deviation measures the amount of variation or dispersion in your dataset. When working with samples, we use the sample standard deviation (s). If the population standard deviation (σ) is known (which is rare), we can use that instead.
Sample Size (n)
The number of observations in your sample. Larger sample sizes generally lead to narrower confidence intervals, indicating more precise estimates.
Confidence Level
The probability that the confidence interval contains the true population parameter. Common confidence levels include 90%, 95%, and 99%. The confidence level determines the corresponding Z-score or t-score used in the calculation.
The Confidence Interval Formula
The formula for calculating a confidence interval depends on whether you know the population standard deviation and your sample size. Here are the two main formulas:
When Population Standard Deviation (σ) is Known:
Confidence Interval = x̄ ± Zα/2 × (σ/√n)
Where:
- x̄ = sample mean
- Zα/2 = Z-score corresponding to your confidence level
- σ = population standard deviation
- n = sample size
When Population Standard Deviation is Unknown (more common):
Confidence Interval = x̄ ± tα/2 × (s/√n)
Where:
- x̄ = sample mean
- tα/2 = t-score corresponding to your confidence level with (n-1) degrees of freedom
- s = sample standard deviation
- n = sample size
Common Z-scores and t-scores for Different Confidence Levels:
| Confidence Level | Z-score (Zα/2) | t-score (varies with df) |
| 90% | 1.645 | Depends on df |
| 95% | 1.96 | Depends on df |
| 99% | 2.576 | Depends on df |

Step-by-Step Calculation Guide
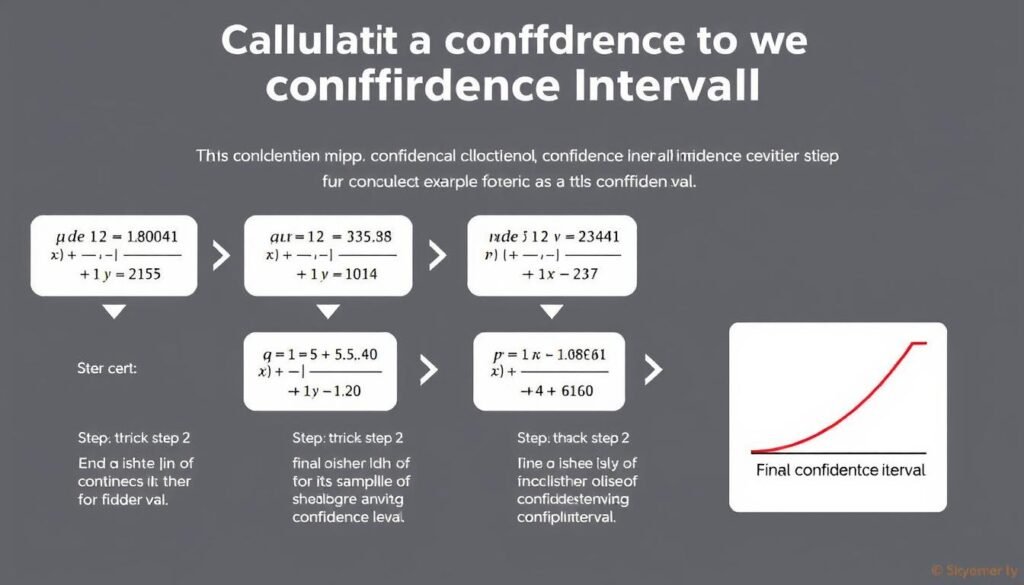
Let's walk through a practical example of calculating a 95% confidence interval manually:
Example Problem:
A researcher measures the cholesterol levels of 40 patients and finds a sample mean of 210 mg/dL with a sample standard deviation of 15 mg/dL. Calculate the 95% confidence interval for the true mean cholesterol level.
Step 1: Identify the values
- Sample mean (x̄) = 210 mg/dL
- Sample standard deviation (s) = 15 mg/dL
- Sample size (n) = 40
- Confidence level = 95%
Step 2: Determine the appropriate distribution
Since we don't know the population standard deviation, we'll use the t-distribution with (n-1) = 39 degrees of freedom.
Step 3: Find the critical value
For a 95% confidence level with 39 degrees of freedom, the t-critical value is approximately 2.023.
Step 4: Calculate the margin of error
Margin of Error = tα/2 × (s/√n) = 2.023 × (15/√40) = 2.023 × 2.37 = 4.79
Step 5: Determine the confidence interval
Lower bound = x̄ - Margin of Error = 210 - 4.79 = 205.21 mg/dL
Upper bound = x̄ + Margin of Error = 210 + 4.79 = 214.79 mg/dL
Therefore, the 95% confidence interval is (205.21, 214.79) mg/dL.
Skip the Complex Calculations
Why spend time on manual calculations when our Confidence Interval Calculator can do it instantly? Get accurate results with just a few clicks.
How to Interpret Confidence Interval Results
Understanding what a confidence interval actually means is just as important as calculating it correctly. Here's how to interpret your results:
Correct Interpretation:
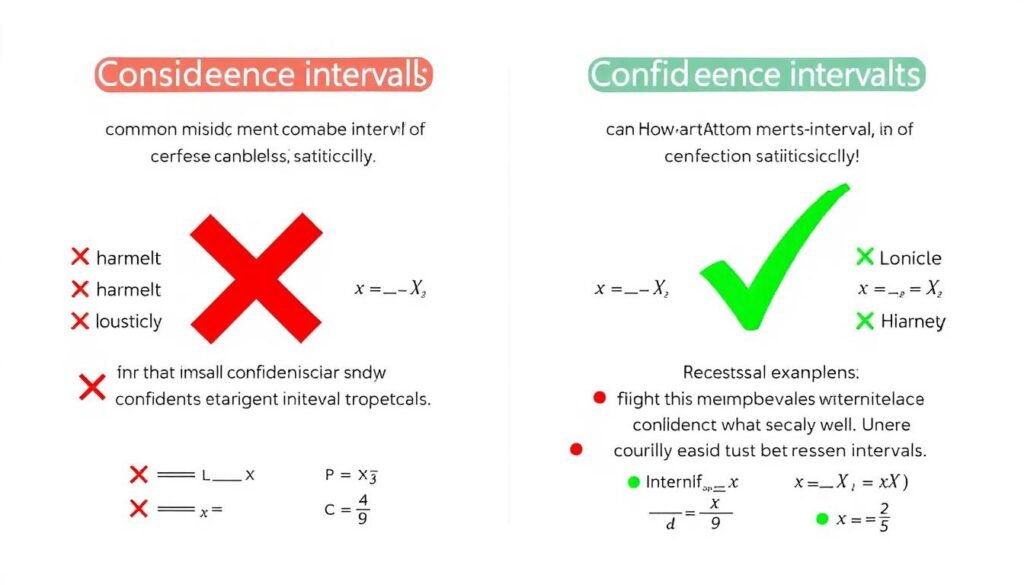
If you were to take many random samples from the same population and calculate a 95% confidence interval for each sample, approximately 95% of these intervals would contain the true population parameter.
Common Misinterpretations:
- Incorrect: "There is a 95% probability that the true population mean lies within this interval."
- Incorrect: "95% of the population values fall within this interval."
Practical Example:
For our cholesterol example, we can say: "We are 95% confident that the true mean cholesterol level in the population is between 205.21 and 214.79 mg/dL."
What Affects the Width of a Confidence Interval?
Narrower Intervals:
- Larger sample sizes
- Smaller standard deviations
- Lower confidence levels (e.g., 90% vs. 95%)
Wider Intervals:
- Smaller sample sizes
- Larger standard deviations
- Higher confidence levels (e.g., 99% vs. 95%)
Why Use Our Confidence Interval Calculator?
Benefits of Using Our Calculator
- Save time with instant, accurate calculations
- Eliminate human error in complex statistical formulas
- Automatically selects the appropriate distribution (Z or t)
- Calculate intervals for various confidence levels (90%, 95%, 99%)
- No statistical software knowledge required
Challenges of Manual Calculation
- Time-consuming multi-step process
- Requires lookup tables for critical values
- Prone to calculation errors
- Need to select the correct formula based on conditions
- Difficult to recalculate for different confidence levels

Calculate With Confidence
Get precise confidence intervals in seconds without the hassle of manual calculations. Perfect for students, researchers, and professionals.
Real-World Applications of Confidence Intervals
Medical Research
Researchers use confidence intervals to estimate treatment effects, drug efficacy, and patient outcomes in clinical trials. For example, a study might report: "The new treatment reduced symptoms by 35% (95% CI: 28% to 42%)."
Quality Control
Manufacturers use confidence intervals to monitor product quality and ensure specifications are met. This helps in maintaining consistent product performance and identifying potential issues in production processes.
Opinion Polls
Political polls report margins of error based on confidence intervals. When a poll shows a candidate has 52% support with a ±3% margin of error, it represents a 95% confidence interval of 49% to 55%.

Frequently Asked Questions
What is a 95% confidence interval?
A 95% confidence interval is a range of values that you can be 95% confident contains the true population parameter. It means that if you were to take 100 different samples and compute a 95% confidence interval for each sample, approximately 95 of the 100 confidence intervals would contain the true population parameter.
How does sample size affect the confidence interval?
Sample size has an inverse relationship with the width of a confidence interval. As sample size increases, the confidence interval becomes narrower, indicating a more precise estimate. This happens because the standard error (s/√n) decreases as n increases. Larger samples provide more information about the population, reducing uncertainty in our estimates.
What is the difference between a confidence interval and a confidence level?
The confidence level is the probability value associated with a confidence interval, typically expressed as a percentage (e.g., 95%). It represents the reliability of the estimation procedure. The confidence interval is the actual range of values calculated using that confidence level. For example, with a 95% confidence level, you might calculate a confidence interval of 10-15 for a population mean.
When should I use a z-score vs. a t-score?
Use a z-score when you know the population standard deviation (σ) or when your sample size is large (typically n > 30). Use a t-score when you don't know the population standard deviation and are using the sample standard deviation (s) instead, especially with smaller sample sizes. The t-distribution accounts for the extra uncertainty when estimating the population standard deviation from the sample.
Can a confidence interval be greater than 100% or less than 0%?
For certain types of data like proportions or percentages that are naturally bounded between 0% and 100%, confidence intervals should not extend beyond these natural boundaries. However, the raw calculation might produce values outside these bounds, especially with small samples or values close to the boundaries. In such cases, the intervals should be truncated or adjusted methods should be used.
How do I interpret a confidence interval that includes zero?
If a confidence interval for a difference or effect includes zero, it suggests that there may be no statistically significant difference or effect at the corresponding confidence level. For example, if the 95% confidence interval for the difference between two treatment means includes zero, you cannot reject the null hypothesis of no difference at the 5% significance level.
What is margin of error and how is it related to confidence intervals?
The margin of error is half the width of a confidence interval. It represents the maximum likely difference between the estimated value and the true population value. In the formula x̄ ± margin of error, the margin of error equals Zα/2 × (σ/√n) or tα/2 × (s/√n), depending on which distribution is used.
Conclusion
Confidence intervals are powerful statistical tools that provide a range of plausible values for population parameters based on sample data. They offer more information than point estimates alone by communicating the precision and uncertainty in our statistical inferences. Whether you're conducting research, analyzing data, or making evidence-based decisions, understanding and correctly calculating confidence intervals is essential.
While the manual calculation process can be complex and time-consuming, our Confidence Interval Calculator simplifies this task, providing accurate results instantly for any confidence level. By using our calculator, you can focus on interpreting the results and making informed decisions rather than getting caught up in the mathematical details.
Ready to Calculate Your Confidence Interval?
Save time and ensure accuracy with our easy-to-use calculator. Get results in seconds that would take minutes to calculate manually.