Mean, Median, Mode & Range Calculator helps you quickly compute key statistical values for any dataset. Accurate, simple, and perfect for math and data analysis.
Mean, Median, Mode, Range Calculator
Statistical measures help us make sense of data sets by identifying central tendencies and spread. The mean, median, mode, and range are fundamental concepts that provide valuable insights into data distribution and characteristics. This comprehensive guide explains these essential statistical measures, their formulas, calculation methods, and real-world applications.
Understanding the Mean (Average)
The mean, commonly known as the average, is one of the most widely used measures of central tendency in statistics. It represents the sum of all values divided by the total number of values in a data set.
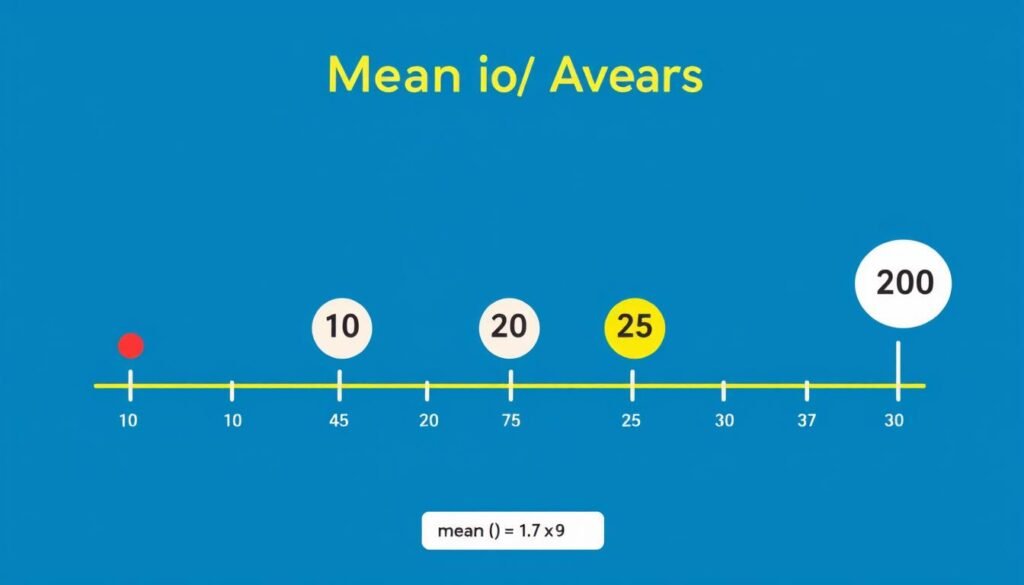
Figure 1: Visual representation of the mean calculation
Mean Formula
The arithmetic mean is calculated using the following formula:
Mean (μ) = Sum of all values (∑X) / Number of values (N)
Step-by-Step Example: Calculating the Mean
Let’s calculate the mean for the data set [5, 2, 7, 5, 9]:
- Add all the values: 5 + 2 + 7 + 5 + 9 = 28
- Count the number of values: 5
- Divide the sum by the count: 28 ÷ 5 = 5.6
Therefore, the mean of this data set is 5.6.
When to Use the Mean
The mean is most useful when:
- The data is symmetrically distributed without extreme outliers
- You need a measure that takes all values into account
- You’re analyzing continuous data like heights, weights, or temperatures
The mean is sensitive to outliers. A single extremely high or low value can significantly affect the mean, potentially making it less representative of the typical value in the data set.
Ready to Calculate Quickly?
Save time and avoid calculation errors with our easy-to-use Mean, Median, Mode, Range Calculator.
Finding the Median: The Middle Value
The median is the middle value in a sorted data set. It divides the data into two equal halves, with 50% of values below and 50% above the median.
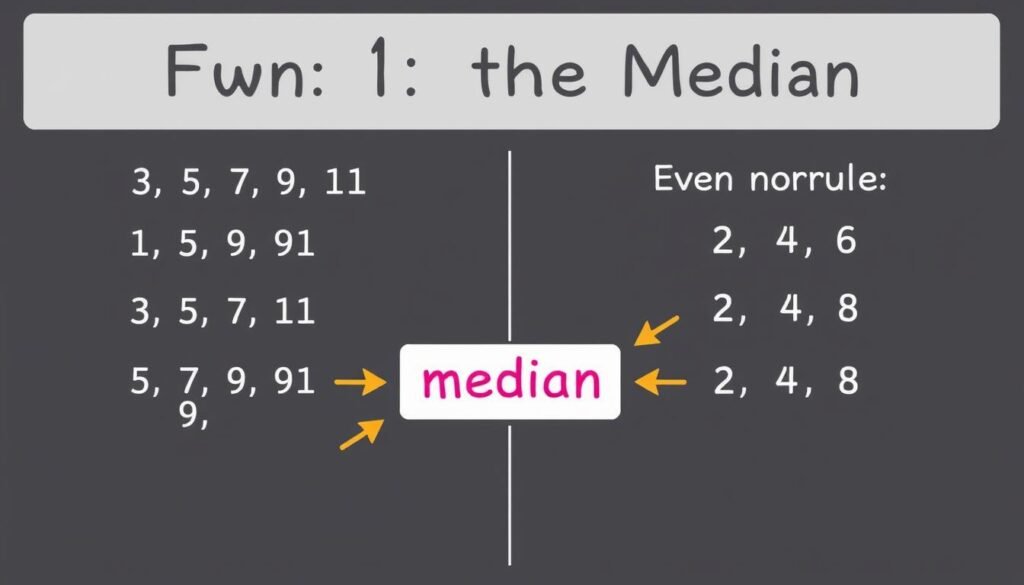
Figure 2: Finding the median in ordered data sets
How to Calculate the Median
The process for finding the median depends on whether the number of values is odd or even:
For an Odd Number of Values:
The median is the middle value when the data is arranged in ascending or descending order.
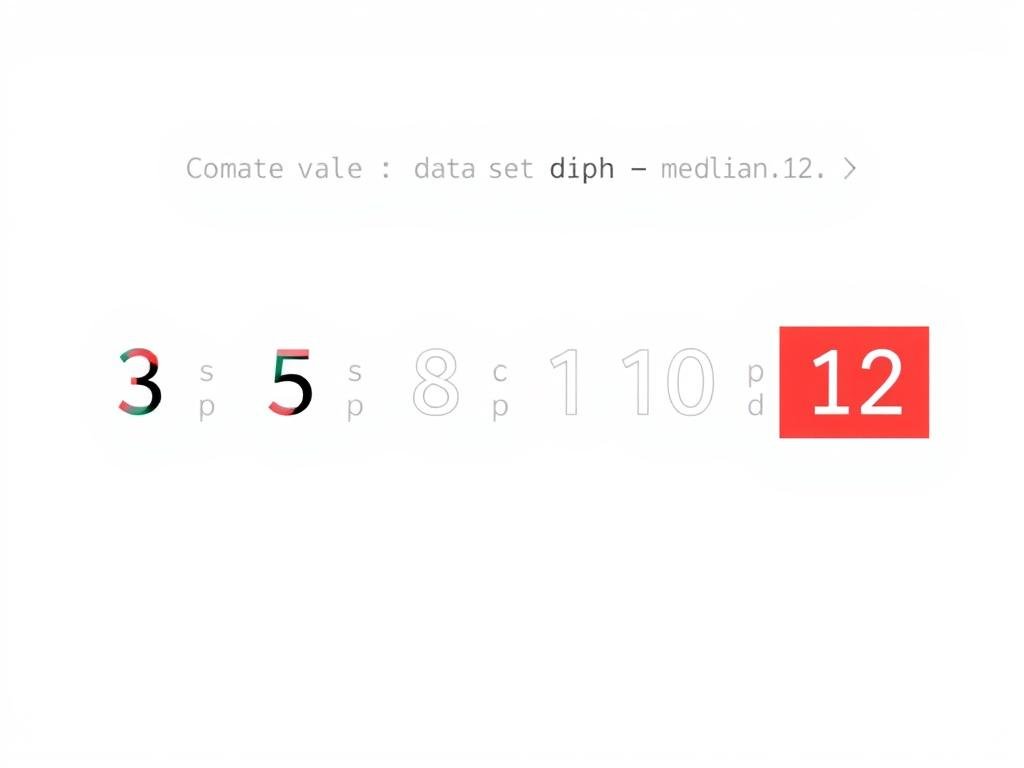
For an Even Number of Values:
The median is the average of the two middle values when the data is arranged in order.

Step-by-Step Example: Finding the Median
Let’s find the median for the data set [5, 2, 7, 5, 9]:
- Arrange the values in ascending order: [2, 5, 5, 7, 9]
- Identify the middle position: Since there are 5 values (odd), the middle position is (5+1)/2 = 3rd position
- The value at the 3rd position is 5
Therefore, the median of this data set is 5.
When to Use the Median
The median is particularly useful when:
- The data contains outliers that would skew the mean
- The data is skewed (not symmetrically distributed)
- Working with ordinal data or rankings
- Analyzing income, housing prices, or other data with potential extreme values
Exploring the Mode: Most Frequent Value
The mode is the value that appears most frequently in a data set. Unlike the mean and median, a data set can have one mode (unimodal), multiple modes (multimodal), or no mode at all.
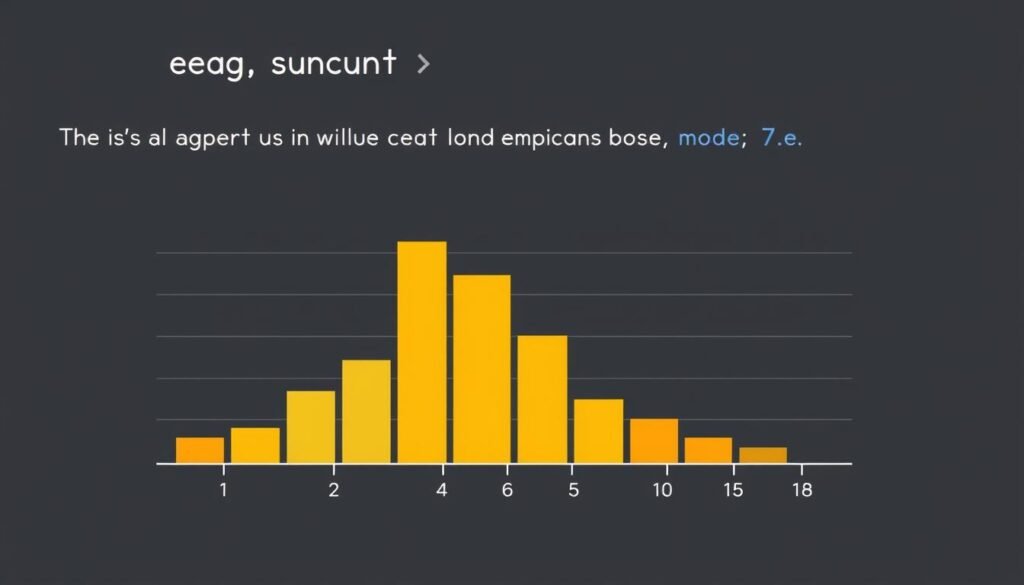
Figure 3: Histogram showing the mode as the peak frequency
How to Find the Mode
To find the mode of a data set:
- Count the frequency of each value in the data set
- Identify the value(s) that occur most frequently
Step-by-Step Example: Finding the Mode
Let’s find the mode for the data set [5, 2, 7, 5, 9]:
| Value | Frequency |
| 2 | 1 |
| 5 | 2 |
| 7 | 1 |
| 9 | 1 |
The value 5 appears twice, while all other values appear only once. Therefore, the mode of this data set is 5.
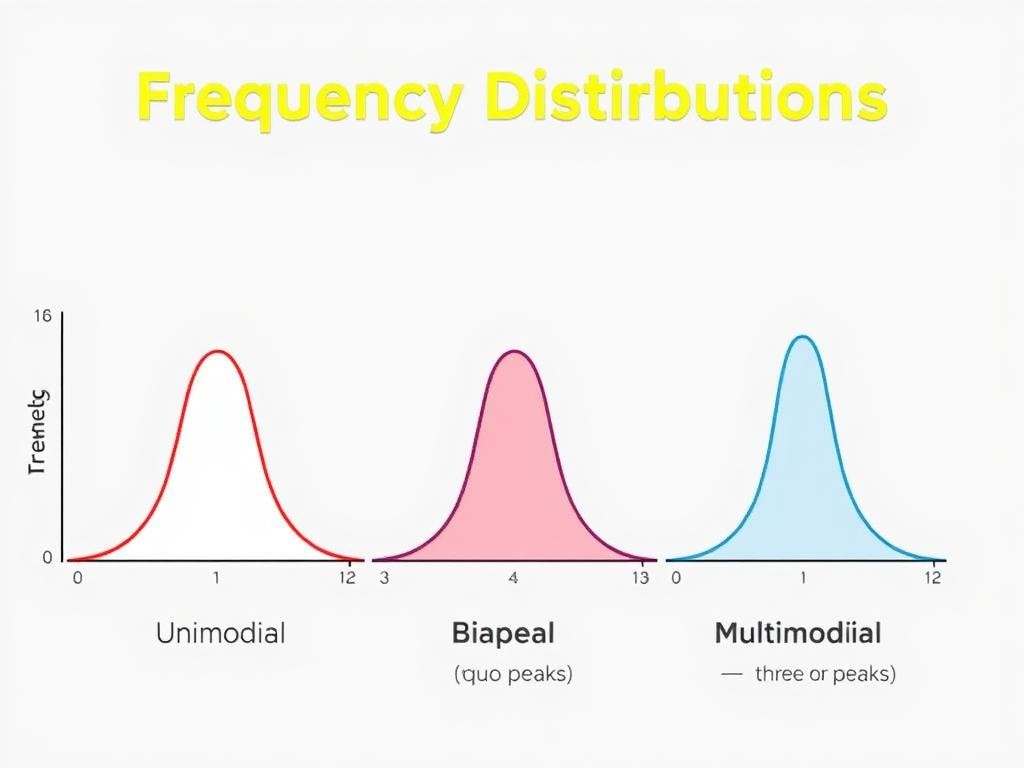
Figure 4: Unimodal, bimodal, and multimodal distributions
When to Use the Mode
The mode is most useful when:
- You need to find the most common category or value
- Working with categorical data (like favorite colors, shoe sizes)
- Analyzing the most popular item or choice
- The frequency of occurrence is more important than the actual values
Need Quick Statistical Analysis?
Our Mean, Median, Mode, Range Calculator handles all calculations instantly, allowing you to focus on interpreting the results.
Understanding Range: Measuring Data Spread
The range is the simplest measure of dispersion or spread in a data set. It represents the difference between the maximum and minimum values.
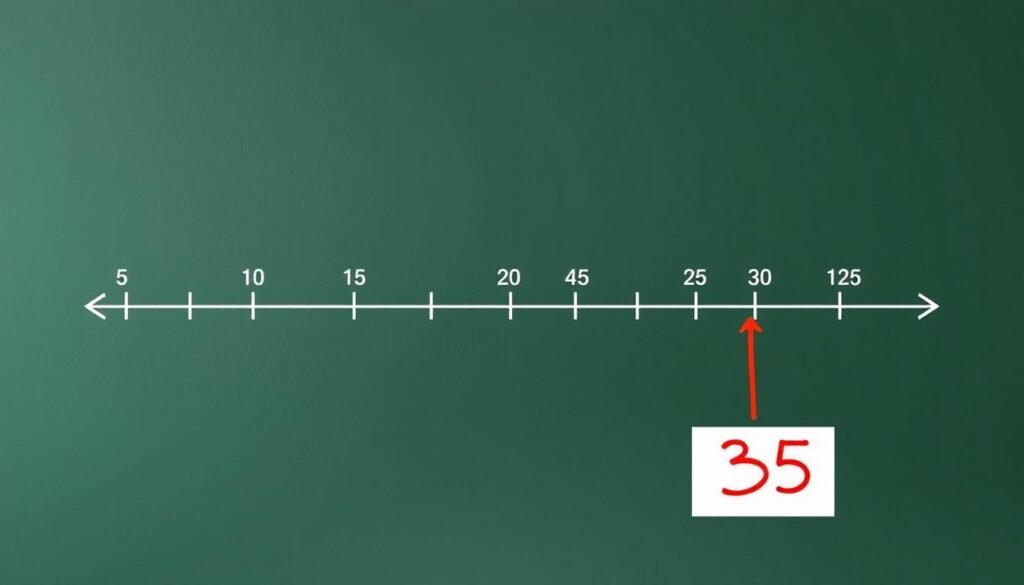
Figure 5: Visual representation of range as the difference between maximum and minimum values
Range Formula
The range is calculated using the following formula:
Range = Maximum value – Minimum value
Step-by-Step Example: Calculating the Range
Let’s calculate the range for the data set [5, 2, 7, 5, 9]:
- Identify the maximum value: 9
- Identify the minimum value: 2
- Calculate the difference: 9 – 2 = 7
Therefore, the range of this data set is 7.
When to Use the Range
The range is most useful when:
- You need a quick, simple measure of data spread
- Comparing the variability between different data sets
- Working with small data sets without extreme outliers
- Analyzing ranges like temperature fluctuations or price variations
The range is highly sensitive to outliers since it only considers the two extreme values in the data set. For more robust measures of spread, consider using the interquartile range, variance, or standard deviation.
Comparing Mean, Median, Mode, and Range
Each statistical measure provides different insights about your data. Understanding when to use each measure is crucial for accurate data interpretation.
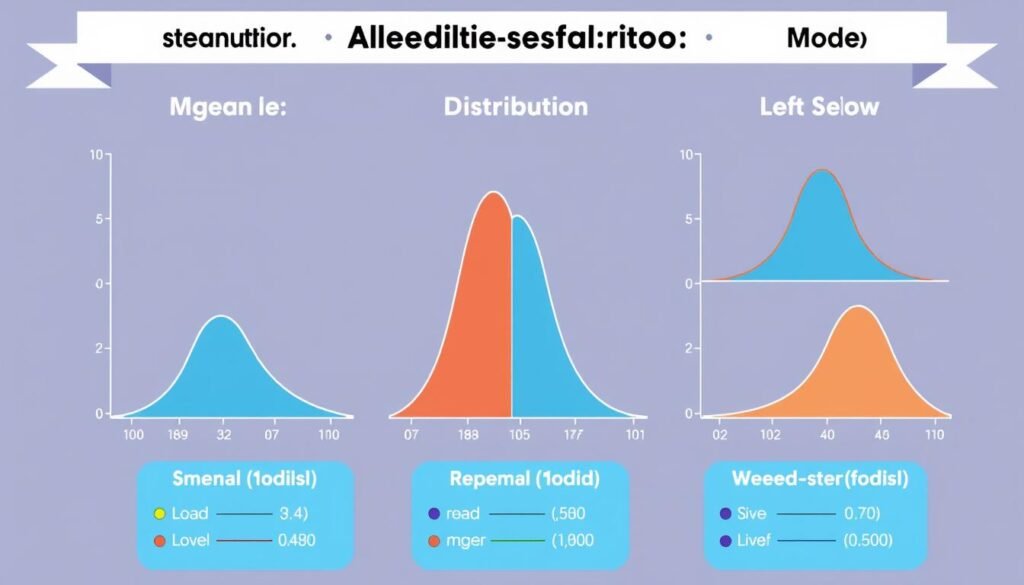
Figure 6: Comparison of mean, median, and mode in different distributions
| Measure | Definition | Best Used When | Limitations |
| Mean | Average of all values | Data is symmetrically distributed | Sensitive to outliers |
| Median | Middle value in ordered data | Data is skewed or has outliers | Doesn’t use all data points |
| Mode | Most frequent value | Working with categorical data | May not exist or may be multiple |
| Range | Difference between max and min | Quick measure of spread needed | Extremely sensitive to outliers |
Distribution Types and Central Tendency
Symmetric Distribution
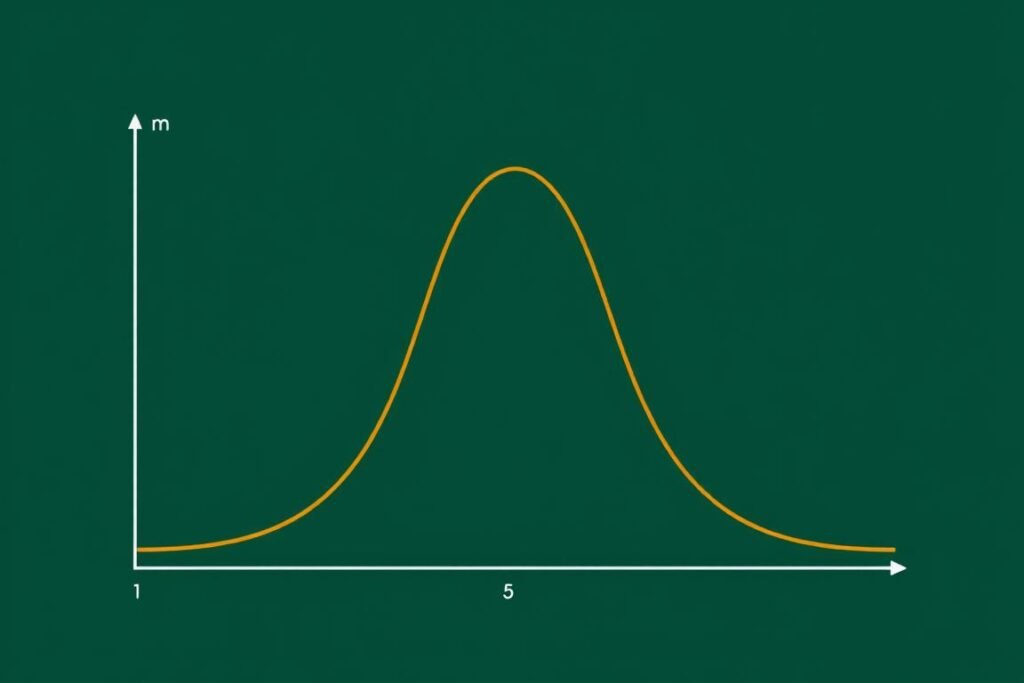
In a symmetric distribution, the mean, median, and mode are approximately equal.
Right-Skewed Distribution
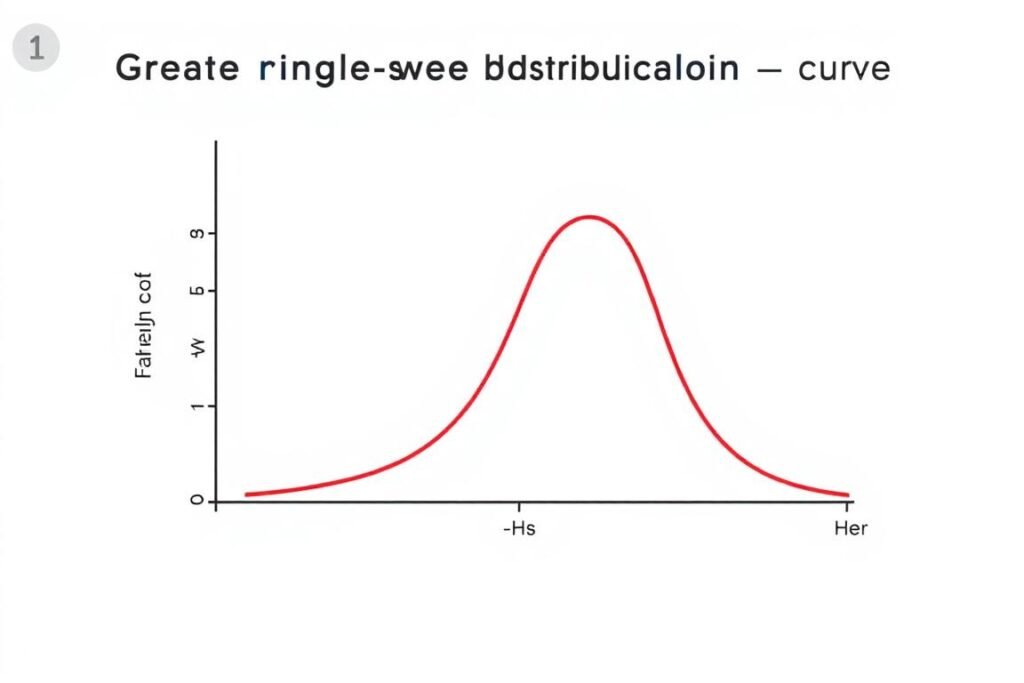
In a right-skewed distribution: Mode
Left-Skewed Distribution
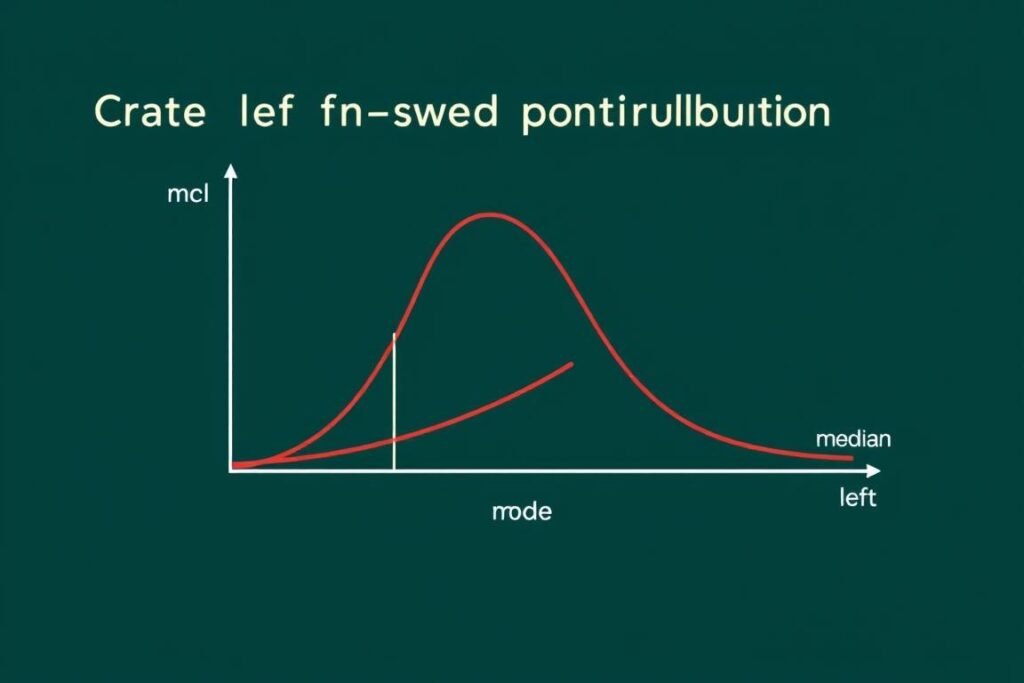
In a left-skewed distribution: Mean
Master Statistical Analysis
Now that you understand these statistical concepts, use our Mean, Median, Mode, Range Calculator for instant, accurate results!
Real-World Applications
Mean, median, mode, and range are used across various fields to analyze data and make informed decisions.

Figure 7: Real-world applications of statistical measures
Education
- Mean: Average test scores to evaluate class performance
- Median: Middle score to determine typical student performance
- Mode: Most common grade to identify frequent achievement levels
- Range: Spread between highest and lowest scores
Finance
- Mean: Average return on investments
- Median: Middle income value for economic analysis
- Mode: Most common price point for product positioning
- Range: Difference between highest and lowest stock prices
Healthcare
- Mean: Average recovery time for treatments
- Median: Middle value for patient survival rates
- Mode: Most common diagnosis or symptom
- Range: Variation in patient response to medication
“Statistics are the poetry of science.” – Karl Pearson
Conclusion
Understanding mean, median, mode, and range provides essential tools for analyzing and interpreting data. Each measure offers unique insights:
- The mean provides the average value, useful for symmetrically distributed data
- The median identifies the middle value, ideal for skewed data or when outliers are present
- The mode reveals the most common value, perfect for categorical data
- The range measures the spread between extremes, giving a simple view of data dispersion
By applying these statistical concepts, you can make more informed decisions based on data in education, business, science, and everyday life. Remember to choose the appropriate measure based on your data type and distribution to ensure accurate interpretation.
Start Analyzing Your Data Today
Now that you understand these statistical concepts, try our Mean, Median, Mode, Range Calculator for instant results!