Statistics Calculator helps you calculate mean, median, mode, standard deviation, and more. Quick, accurate tool for data analysis and statistics problems.
Statistics Calculator
Statistics is the science of collecting, analyzing, interpreting, and presenting data. Whether you’re a student tackling a statistics course, a researcher analyzing experimental results, or a business professional making data-driven decisions, a statistics calculator is an invaluable tool that simplifies complex calculations and helps you draw meaningful conclusions from your data.
In this comprehensive guide, we’ll explore the fundamental concepts of statistics, explain key statistical measures, and demonstrate how a statistics calculator can transform your approach to data analysis. From basic descriptive statistics to more advanced calculations, you’ll discover how this powerful tool can save you time and ensure accuracy in your statistical work.
Understanding Statistics and Why You Need a Calculator
A modern statistics calculator interface displaying various statistical functions
Statistics provides methods to analyze and interpret data, helping us make sense of information and draw meaningful conclusions. At its core, statistics involves two main branches: descriptive statistics, which summarizes data, and inferential statistics, which draws conclusions about populations based on sample data.
While manual statistical calculations are possible, they can be time-consuming and prone to errors, especially with large data sets. This is where a statistics calculator becomes essential. These specialized tools are designed to perform complex calculations quickly and accurately, allowing you to focus on interpreting results rather than getting bogged down in mathematical operations.
Ready to Simplify Your Statistical Calculations?
Stop struggling with manual calculations and potential errors. Our statistics calculator handles the math so you can focus on analysis.
Key Benefits of Using a Statistics Calculator
Time Efficiency
Calculate complex statistical measures in seconds rather than spending minutes or hours on manual calculations.
Accuracy
Eliminate human error from your calculations, ensuring reliable results for your research or assignments.
Accessibility
Access advanced statistical functions without needing specialized knowledge of statistical formulas.
Visualization
Many statistics calculators offer graphical representations of your data, making interpretation easier.
Comprehensive Analysis
Perform multiple statistical tests simultaneously to gain deeper insights from your data set.
Learning Tool
Understand statistical concepts better by seeing calculations performed step-by-step.
Essential Descriptive Statistics Calculations
Descriptive statistics summarize and organize data in a meaningful way. These measures form the foundation of statistical analysis and are typically the first calculations performed on any data set. Let’s explore the key descriptive statistics that most statistics calculators can compute instantly.
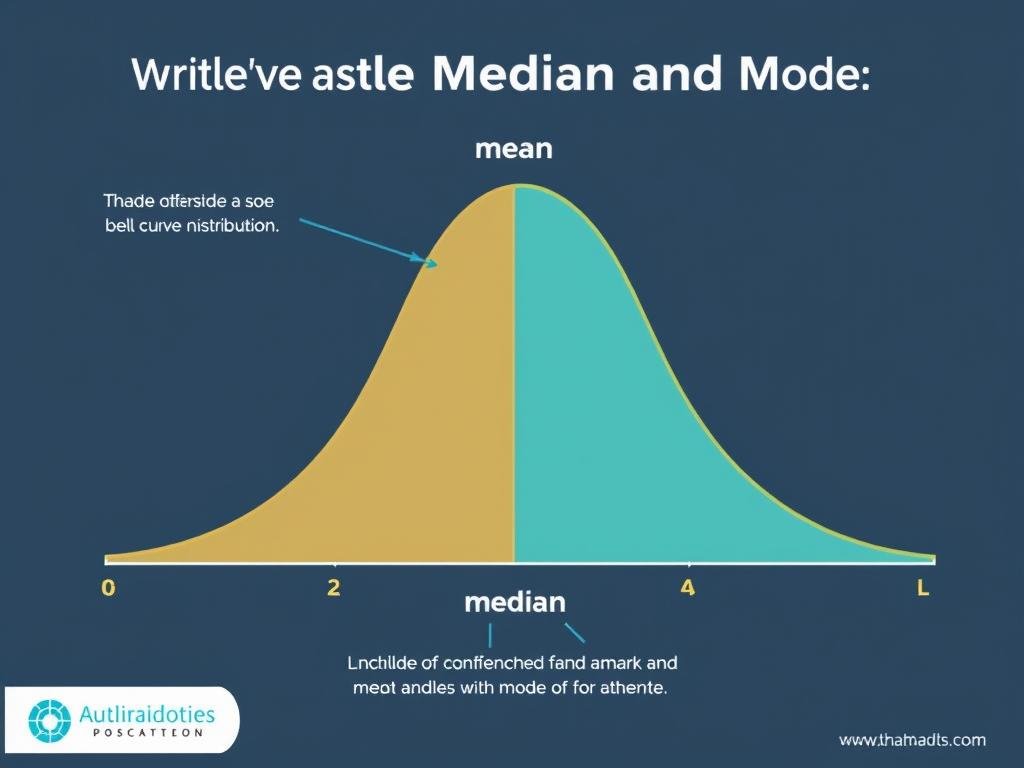
Visual representation of mean, median, and mode in a statistical distribution
Measures of Central Tendency
Mean (Average)
The mean is the sum of all values in a data set divided by the count of values. It represents the “average” value and is calculated using the formula:
Mean = (Sum of all values) ÷ (Number of values)
For example, for the data set {4, 8, 15, 16, 23, 42}, the mean is:
(4 + 8 + 15 + 16 + 23 + 42) ÷ 6 = 108 ÷ 6 = 18
While this calculation is simple with a small data set, a statistics calculator becomes invaluable when working with larger sets of values.
Median
The median is the middle value when a data set is arranged in order. For an odd number of values, it’s the middle value. For an even number, it’s the average of the two middle values.
For the data set {4, 8, 15, 16, 23, 42}:
Arrange in order: 4, 8, 15, 16, 23, 42
Since there are 6 values (even), the median is the average of the 3rd and 4th values:
Median = (15 + 16) ÷ 2 = 15.5
The median is less affected by outliers than the mean, making it valuable for skewed distributions.
Mode
The mode is the value that appears most frequently in a data set. A data set may have one mode, multiple modes, or no mode.
For example, in the data set {4, 8, 15, 15, 16, 23, 42}, the mode is 15 because it appears twice while all other values appear only once.
Finding the mode manually requires counting the frequency of each value, which becomes tedious with large data sets. A statistics calculator identifies the mode instantly, regardless of data set size.
Measures of Dispersion
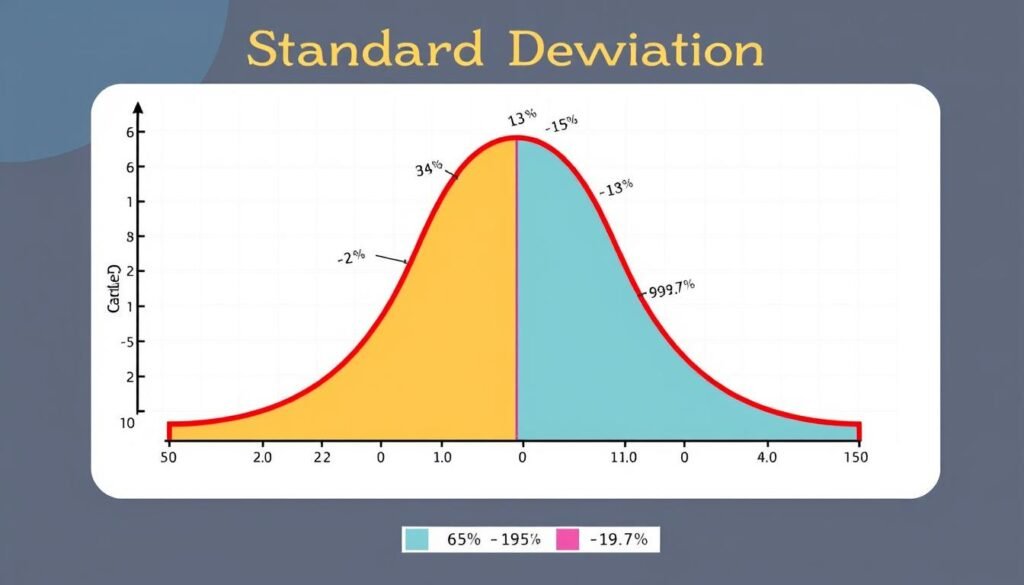
Standard deviation illustrated on a normal distribution curve
Range
The range is the difference between the maximum and minimum values in a data set. It provides a simple measure of spread but is heavily influenced by outliers.
For the data set {4, 8, 15, 16, 23, 42}:
Range = Maximum value – Minimum value = 42 – 4 = 38
While calculating the range is straightforward, a statistics calculator can quickly identify the minimum and maximum values in large data sets.
Variance
Variance measures how far each value in the data set is from the mean. It’s calculated by finding the average of the squared differences from the mean. The formula differs slightly for population data versus sample data:
Population variance (σ²) = Σ(x – μ)² ÷ N
Sample variance (s²) = Σ(x – x̄)² ÷ (n-1)
Where x represents each value, μ (or x̄) is the mean, and N (or n) is the number of values.
This calculation becomes complex with large data sets, making a statistics calculator essential for accurate results.
Standard Deviation
Standard deviation is the square root of the variance. It measures the average distance between each data point and the mean, providing insight into how spread out the values are.
Population standard deviation (σ) = √σ²
Sample standard deviation (s) = √s²
Standard deviation is widely used in statistics because it’s in the same units as the original data, making it more interpretable than variance.
Calculating standard deviation manually involves multiple steps and is prone to errors. A statistics calculator performs this calculation instantly and accurately.
Advanced Statistical Calculations Made Simple
Beyond basic descriptive statistics, a statistics calculator can perform more advanced calculations that would be challenging to compute manually. These advanced features make statistical analysis more accessible and comprehensive.
Advanced statistical analysis showing multiple probability distributions
Probability Distributions
Normal Distribution Calculations
The normal distribution (bell curve) is fundamental in statistics. A statistics calculator can compute:
- Probability density function (PDF) values
- Cumulative distribution function (CDF) values
- Z-scores and their corresponding probabilities
- Inverse normal calculations (finding values given probabilities)
For example, to find the probability of a value falling below 1.5 standard deviations above the mean, you would need to calculate the CDF of Z = 1.5, which equals approximately 0.9332 or 93.32%.
Student’s t-Distribution
The t-distribution is used when sample sizes are small or the population standard deviation is unknown. A statistics calculator can compute:
- t-values for specific degrees of freedom
- Probabilities associated with t-values
- Critical t-values for confidence intervals
These calculations are particularly important for hypothesis testing and constructing confidence intervals in research and data analysis.
Correlation and Regression
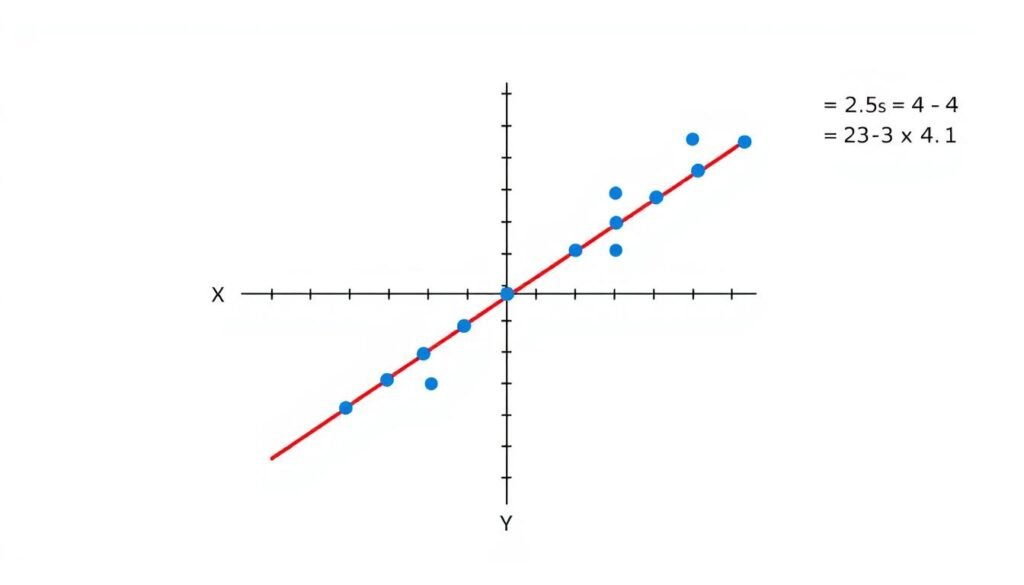
Scatter plot with regression line showing correlation between two variables
Correlation Coefficient
The correlation coefficient (r) measures the strength and direction of a linear relationship between two variables. It ranges from -1 (perfect negative correlation) to +1 (perfect positive correlation), with 0 indicating no correlation.
Calculating r manually involves multiple steps:
r = Σ[(x – x̄)(y – ȳ)] ÷ √[Σ(x – x̄)² × Σ(y – ȳ)²]
A statistics calculator computes this value instantly, saving time and eliminating calculation errors.
Linear Regression
Linear regression finds the best-fitting line through a set of data points. A statistics calculator can:
- Calculate the regression equation (y = mx + b)
- Determine the coefficient of determination (R²)
- Compute standard errors and confidence intervals
- Perform residual analysis
These calculations provide insights into how well one variable can predict another, which is valuable for forecasting and understanding relationships between variables.
Real-World Applications of a Statistics Calculator
Statistics calculators have practical applications across numerous fields. Understanding these applications helps appreciate the value of having a reliable statistics calculator at your disposal.

Business professionals using statistical analysis for data-driven decision making
Academic Research
Researchers use statistics calculators to analyze experimental data, test hypotheses, and validate findings. From psychology studies to medical research, statistical analysis is essential for drawing meaningful conclusions.
Example: A psychology researcher analyzing survey responses to determine if a new therapy technique shows statistically significant improvement over traditional methods.
Business Analytics
Businesses rely on statistical analysis to make data-driven decisions. From market research to quality control, statistics calculators help identify trends, forecast outcomes, and optimize processes.
Example: A retail company analyzing sales data to identify seasonal patterns and optimize inventory management based on statistical forecasts.
Healthcare
Medical professionals use statistics to analyze patient data, evaluate treatment efficacy, and conduct epidemiological studies. Statistics calculators facilitate these analyses, contributing to improved healthcare outcomes.
Example: Epidemiologists calculating infection rates and using statistical models to predict disease spread during an outbreak.
Finance
Financial analysts use statistical tools to assess investment risks, analyze market trends, and develop pricing models. Statistics calculators provide the computational power needed for these complex analyses.
Example: An investment analyst calculating the standard deviation of stock returns to assess investment risk and optimize portfolio allocation.
Education
Students and educators use statistics calculators to learn statistical concepts, complete assignments, and analyze educational data. These tools make statistics more accessible and less intimidating.
Example: A teacher analyzing test scores to determine if a new teaching method has significantly improved student performance.
Sports Analytics
Sports teams and analysts use statistics to evaluate player performance, develop game strategies, and predict outcomes. Statistics calculators help process the vast amounts of data generated in sports.
Example: A baseball analyst calculating advanced metrics like OPS+ or WAR to compare player performance across different eras.

Student using a statistics calculator to solve complex statistical problems
Transform Your Data Analysis Today
Whether you’re a student, researcher, or professional, our statistics calculator will simplify your calculations and enhance your analytical capabilities.
Solving Common Statistical Problems
Many people encounter challenges when performing statistical calculations. Let’s explore some common problems and how a statistics calculator can help solve them efficiently.

Comparison of manual calculation versus using a statistics calculator
How do I handle outliers in my data set?
Outliers can significantly impact statistical measures, especially the mean and standard deviation. A statistics calculator can help by:
- Identifying potential outliers using methods like the 1.5 × IQR rule
- Calculating robust statistics that are less affected by outliers (e.g., median, trimmed mean)
- Providing multiple analyses with and without outliers for comparison
This allows you to make informed decisions about how to handle outliers in your specific context.
How do I determine which statistical test to use?
Choosing the appropriate statistical test can be challenging. Advanced statistics calculators often include decision trees or guides to help select the right test based on:
- The type of data you have (categorical, ordinal, interval, ratio)
- The number of variables and groups you’re comparing
- Whether your data meets assumptions like normality
- Your specific research question or hypothesis
This guidance ensures you’re using the most appropriate statistical method for your analysis.
How do I interpret my statistical results?
Interpreting statistical results correctly is crucial. A comprehensive statistics calculator can help by:
- Providing clear explanations of what each statistical measure means
- Offering context for interpreting values (e.g., what constitutes a strong correlation)
- Generating visual representations that make patterns more apparent
- Including confidence intervals to indicate the precision of estimates
These features transform raw numbers into meaningful insights that can inform decisions.
How do I handle missing data?
Missing data can complicate statistical analysis. A statistics calculator can offer solutions by:
- Providing options for handling missing values (e.g., listwise deletion, pairwise deletion)
- Calculating statistics based on available data with clear indication of sample size
- Offering imputation methods to estimate missing values when appropriate
These approaches ensure your analysis remains valid despite incomplete data.
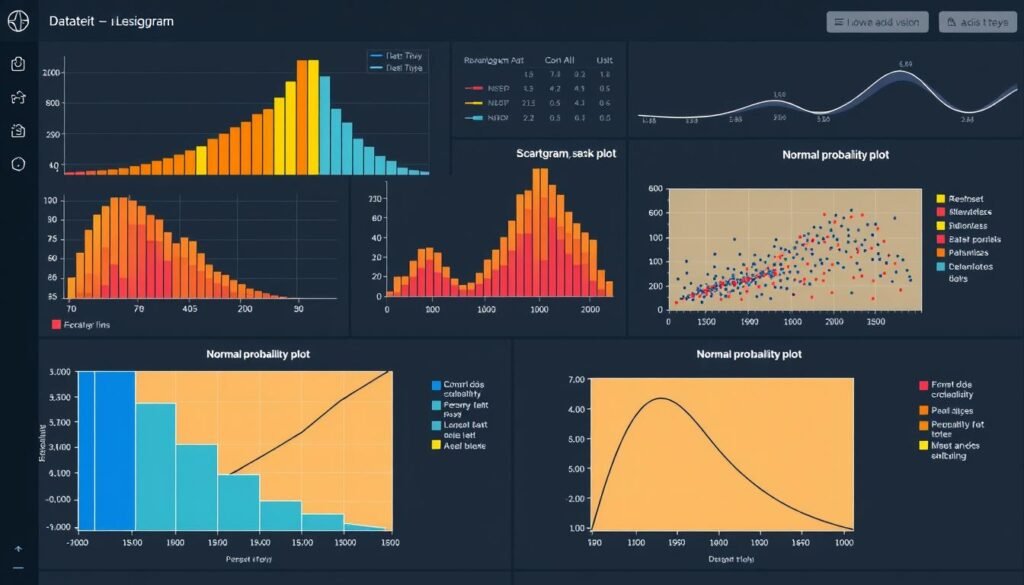
Multiple statistical visualizations revealing different aspects of the same data set
Choosing the Right Statistics Calculator for Your Needs
With numerous statistics calculators available, selecting the right one for your specific needs is important. Consider these factors when choosing a statistics calculator:
What to Look For
- Comprehensive statistical functions covering both basic and advanced calculations
- Clear, step-by-step solutions that explain the calculation process
- Data visualization capabilities to help interpret results
- User-friendly interface that doesn’t require advanced statistical knowledge
- Ability to handle different data formats and large data sets
- Regular updates to ensure accuracy and incorporate new statistical methods
- Educational resources to help understand statistical concepts
What to Avoid
- Calculators with limited functionality that only perform basic calculations
- Tools that provide results without explanations or context
- Outdated interfaces that make data entry difficult or error-prone
- Calculators that can’t handle larger data sets or more complex analyses
- Solutions that require extensive statistical knowledge to interpret results
- Tools without proper documentation or support resources
- Calculators that don’t clearly distinguish between population and sample statistics
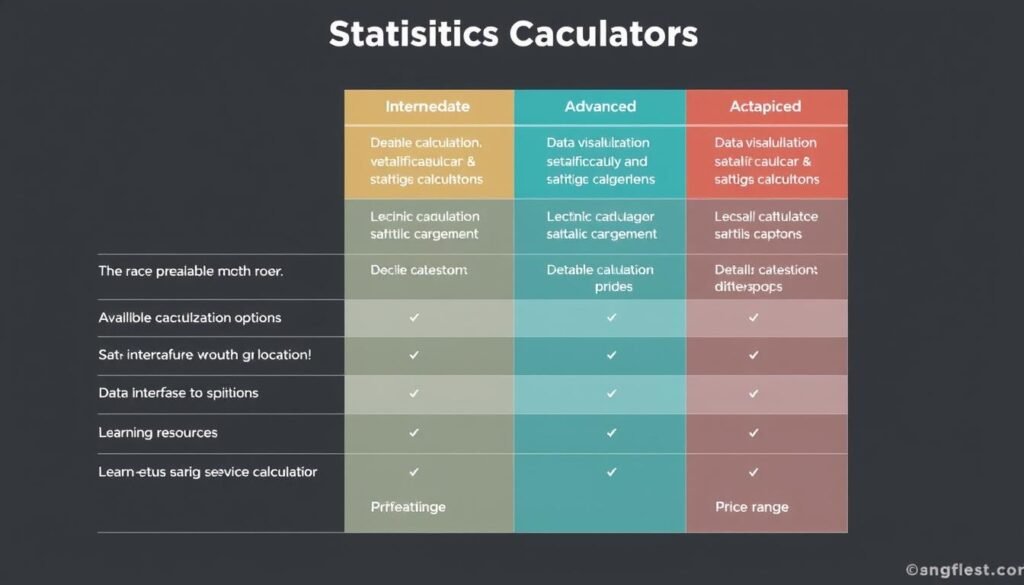
Comparison of features across different types of statistics calculators
Conclusion: Elevate Your Statistical Analysis
Statistics is a powerful tool for understanding data and making informed decisions. A quality statistics calculator transforms complex mathematical operations into simple, accessible processes that anyone can use to gain insights from their data.
From basic descriptive statistics like mean and standard deviation to advanced analyses like regression and hypothesis testing, a statistics calculator empowers you to perform accurate calculations quickly and confidently. This efficiency allows you to focus on interpreting results and applying insights rather than getting caught up in computational details.
Whether you’re a student learning statistics, a researcher analyzing experimental data, or a professional making data-driven decisions, a statistics calculator is an invaluable tool in your analytical toolkit. It simplifies complex calculations, reduces errors, and makes statistical analysis more accessible to everyone.

Confident data analysis powered by effective statistical tools
Start Your Statistical Journey Today
Experience the power of efficient, accurate statistical calculations with our comprehensive statistics calculator. No more manual calculations, no more errors—just clear, reliable results.