Z-Score Calculator helps you quickly calculate Z-scores for data points. Accurate, easy-to-use tool for statistics, probability, and data analysis.
Z-Score Calculator
A z-score (also known as a standard score) measures how many standard deviations a data point is from the mean of a dataset. Understanding z-scores is crucial for statistical analysis, helping you determine the relative position of any value within a normal distribution. Our comprehensive guide explains everything you need to know about z-scores, from basic concepts to practical applications, helping you master this essential statistical tool.
What is a Z-score?
A z-score is a standardized value that indicates how many standard deviations a data point is from the mean of a distribution. It transforms values from any normal distribution into a standard normal distribution with a mean of 0 and a standard deviation of 1.
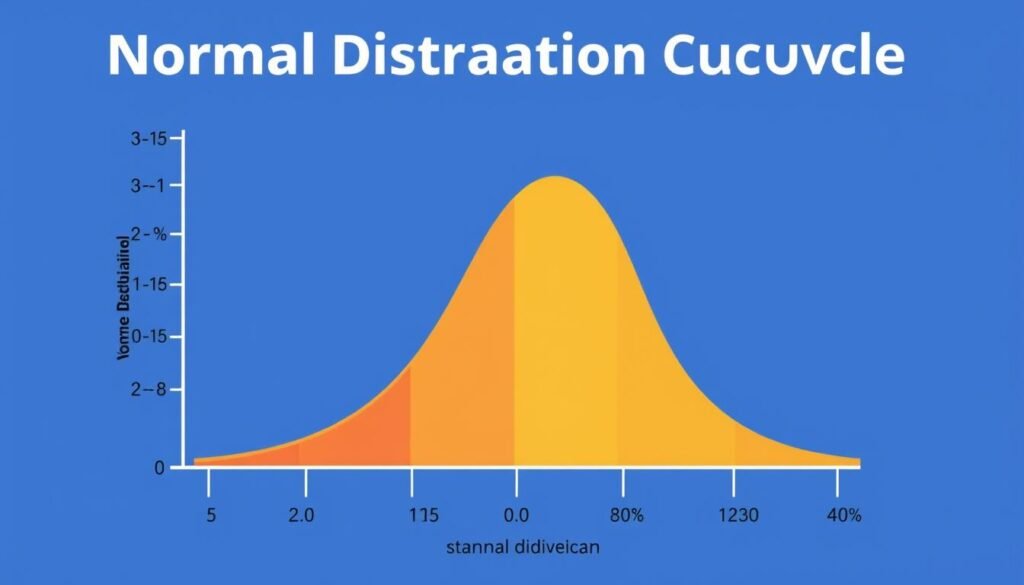
Z-score normal distribution showing standard deviations from the mean
When a z-score is positive, it indicates the data point is above the mean. Conversely, a negative z-score means the data point falls below the mean. A z-score of zero means the data point is exactly at the mean.
Z-scores allow you to compare values from different datasets by standardizing them to a common scale, making it easier to interpret relative positions regardless of the original units of measurement.
By converting raw data to z-scores, you can determine the relative position of any value within a dataset, compare values from different distributions, and identify outliers in your data.
Need to calculate z-scores quickly?
Our Z-score Calculator handles all the complex math for you, allowing you to focus on interpreting your results.
How to Calculate a Z-score
Calculating a z-score requires three pieces of information: the raw data value, the population mean, and the population standard deviation. The formula for calculating a z-score is:
Z-score Formula: Z = (X - μ) / σ
Where:
- Z = z-score
- X = raw data value
- μ (mu) = population mean
- σ (sigma) = population standard deviation
When working with a sample rather than a population, the formula remains similar, but you'll use the sample mean and sample standard deviation instead:
Sample Z-score Formula: Z = (X - x̄) / s
Where:
- Z = z-score
- X = raw data value
- x̄ = sample mean
- s = sample standard deviation
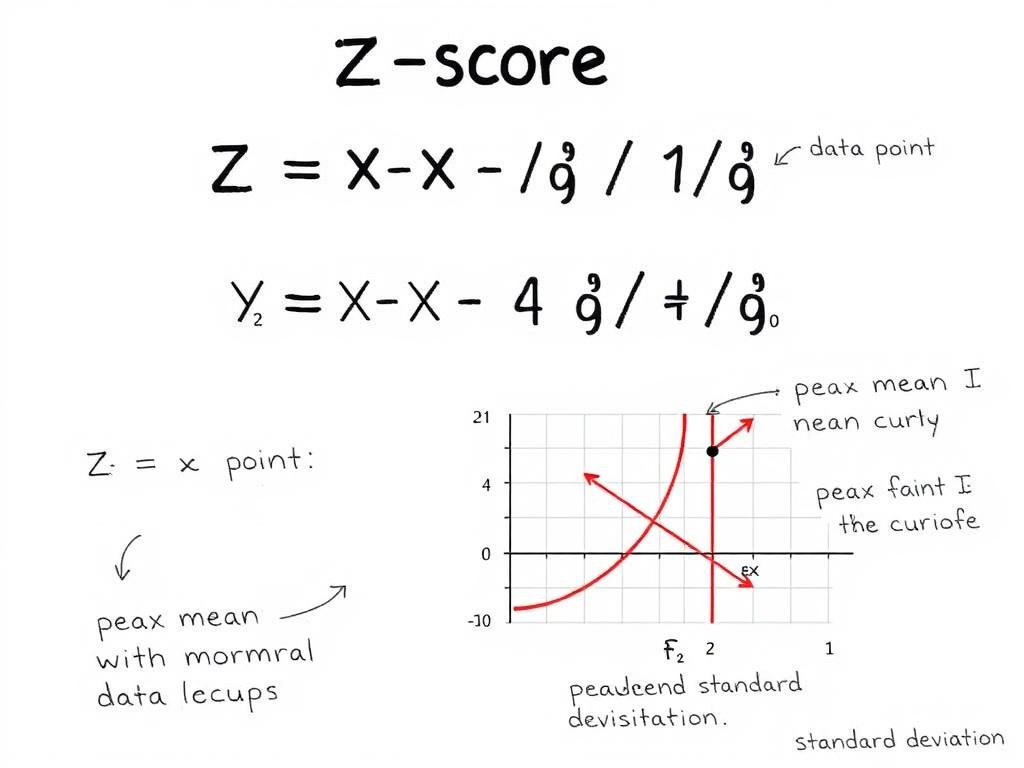
Visual representation of the z-score formula and its components
For calculating the z-score of a sample mean, you'll need to use the standard error of the mean instead of the standard deviation:
Z-score for Sample Mean: Z = (x̄ - μ) / (σ/√n)
Where:
- Z = z-score
- x̄ = sample mean
- μ = population mean
- σ = population standard deviation
- n = sample size
Interpreting Z-score Values
Understanding what z-scores mean is crucial for making informed statistical decisions. Here's how to interpret different z-score values:
Positive Z-scores
A positive z-score indicates that the data point is above the mean. The higher the value, the further it is from the mean.
- Z = 1: The data point is 1 standard deviation above the mean
- Z = 2: The data point is 2 standard deviations above the mean
- Z = 3: The data point is 3 standard deviations above the mean
Negative Z-scores
A negative z-score indicates that the data point is below the mean. The lower the value, the further it is from the mean.
- Z = -1: The data point is 1 standard deviation below the mean
- Z = -2: The data point is 2 standard deviations below the mean
- Z = -3: The data point is 3 standard deviations below the mean
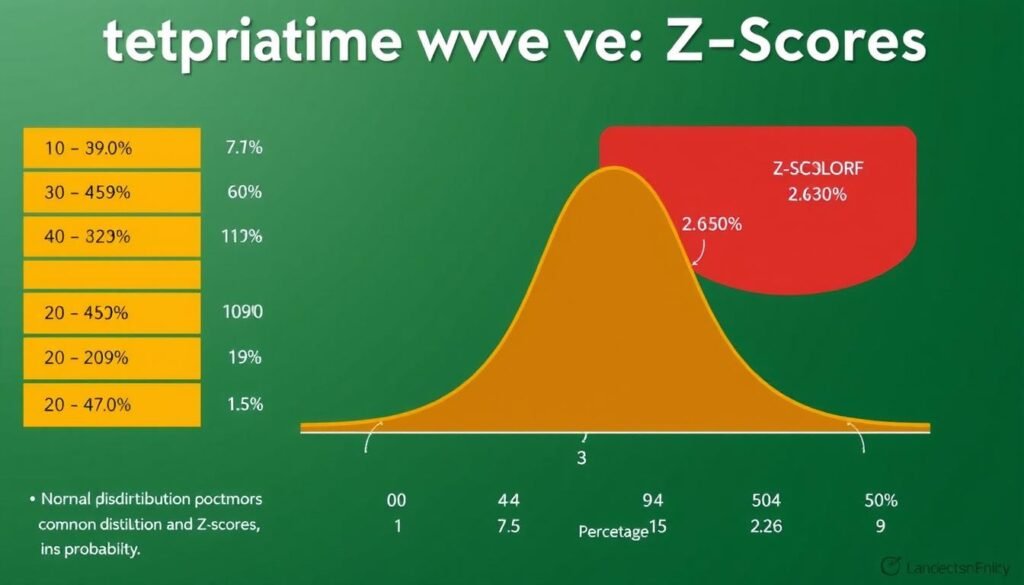
Z-score interpretation chart with probability percentages
In a standard normal distribution, approximately 68% of the data falls within one standard deviation of the mean (between z = -1 and z = 1). About 95% falls within two standard deviations (between z = -2 and z = 2), and 99.7% falls within three standard deviations (between z = -3 and z = 3).
| Z-score Range | Percentage of Data | Interpretation |
| -1 to 1 | 68.27% | Common values |
| -2 to 2 | 95.45% | Typical range |
| -3 to 3 | 99.73% | Almost all values |
| Beyond ±3 | 0.27% | Potential outliers |
Z-scores are particularly useful for identifying outliers in your data. Generally, data points with z-scores beyond ±3 are considered potential outliers, as they fall outside 99.7% of the data in a normal distribution.
Need help interpreting your z-scores?
Our Z-score Calculator not only computes values but also helps you understand what they mean in context.
Practical Applications of Z-scores
Z-scores have numerous practical applications across various fields. Understanding these applications can help you leverage z-scores effectively in your work or studies.

Practical applications of Z-scores across different fields
Educational Assessment
In education, z-scores help standardize test results across different exams or grading systems. This allows for fair comparison of student performance regardless of the difficulty level of different tests or sections.
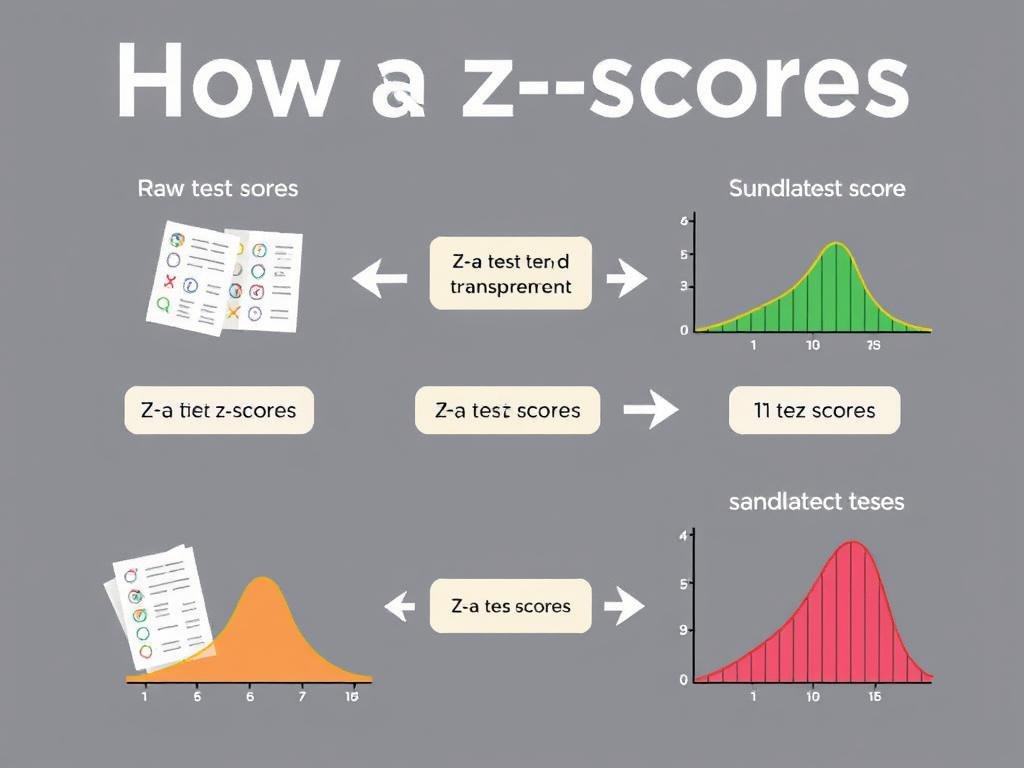
Using Z-scores to standardize educational assessments
Financial Analysis
In finance, z-scores help analyze stock performance, detect financial distress in companies (Altman Z-score), and identify market anomalies. They provide a standardized way to compare financial metrics across different companies or time periods.
Quality Control
Manufacturing and quality control processes use z-scores to monitor production quality and identify when a process is operating outside normal parameters. This helps maintain consistent product quality and detect issues early.
Healthcare and Medical Research
In healthcare, z-scores are used to standardize patient metrics like BMI, blood pressure, or lab results. They help identify when a patient's values fall outside the normal range, potentially indicating a health concern.

Z-scores in healthcare for standardizing and interpreting patient metrics
Research and Data Analysis
Researchers use z-scores to standardize data from different sources or scales, making it possible to compare and analyze diverse datasets. They're also essential for many statistical tests and procedures.
By understanding these applications, you can see how z-scores provide a universal language for comparing data across different contexts and scales.
Step-by-Step Z-score Calculation Example
Let's walk through a complete example of calculating z-scores to solidify your understanding.
Example Scenario: A statistics professor wants to compare student performance on two different exams with different means and standard deviations.
The Data
| Exam | Student Score | Class Mean | Standard Deviation |
| Midterm | 85 | 75 | 8 |
| Final | 92 | 88 | 5 |
Step 1: Calculate the Z-score for the Midterm Exam
Using the formula Z = (X - μ) / σ:
Z = (85 - 75) / 8 = 10 / 8 = 1.25
Step 2: Calculate the Z-score for the Final Exam
Using the same formula:
Z = (92 - 88) / 5 = 4 / 5 = 0.8
Step 3: Interpret the Results
The student's z-score on the midterm is 1.25, meaning they scored 1.25 standard deviations above the mean. On the final exam, their z-score is 0.8, meaning they scored 0.8 standard deviations above the mean.
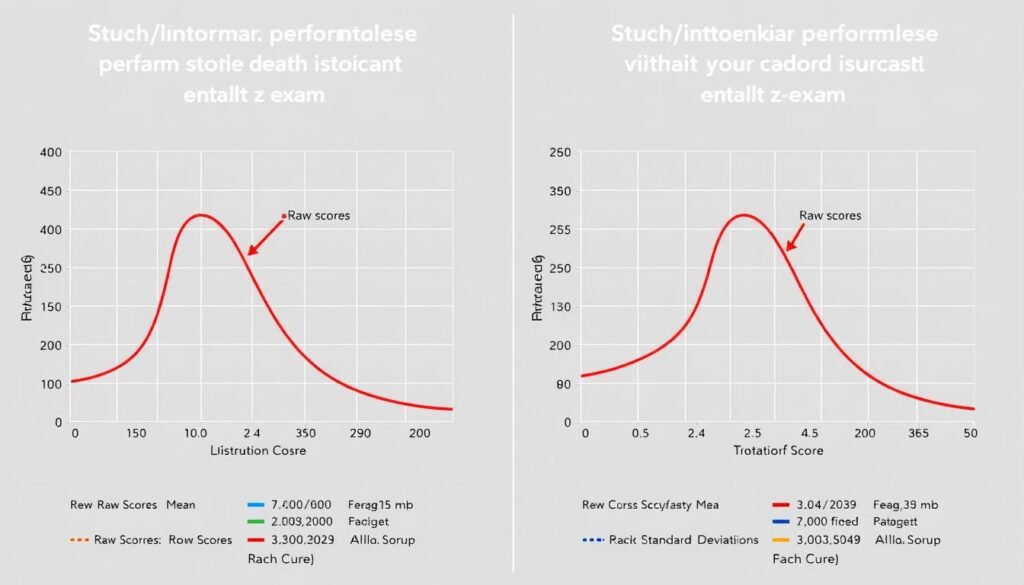
Visual comparison of student performance using Z-scores
Although the raw score on the final exam (92) is higher than on the midterm (85), the z-score tells us that the student's performance relative to the class was actually better on the midterm (z = 1.25) than on the final (z = 0.8).
This example illustrates the power of z-scores: they allow us to compare performance across different distributions, revealing insights that raw scores alone cannot provide.
By converting raw scores to z-scores, we can make fair comparisons between different datasets, regardless of their original scales or distributions.
Ready to calculate your own Z-scores?
Our Z-score Calculator makes the process simple and error-free.
Understanding the Z-score Table
A z-score table (also called a standard normal table) helps you find the probability associated with a particular z-score. This is useful for determining percentiles and making statistical inferences.
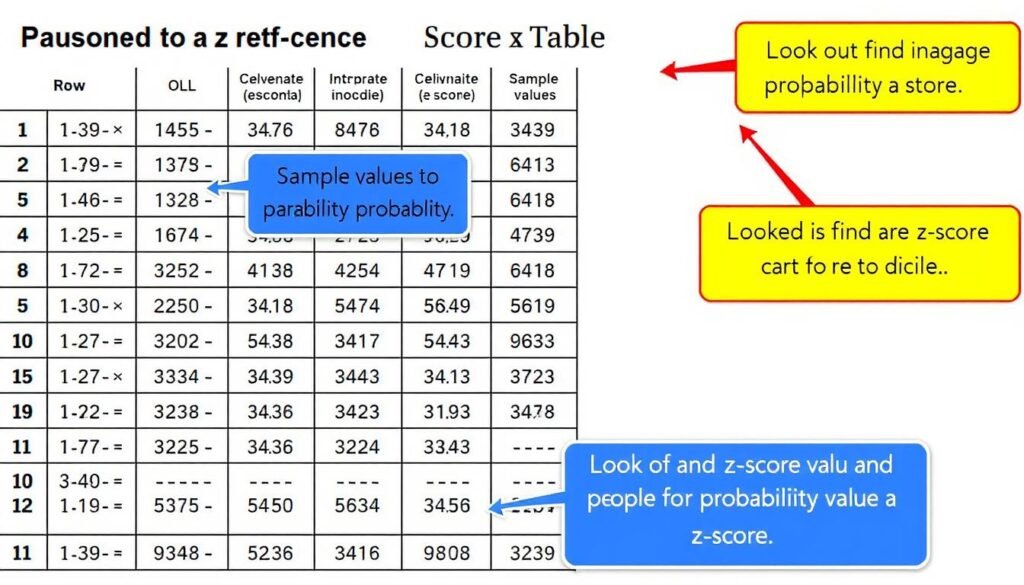
Z-score table with instructions on how to read it
How to Read a Z-score Table
A standard z-table shows the area under the normal curve to the left of a given z-score. To use the table:
- Find the row corresponding to the first decimal place of your z-score
- Find the column corresponding to the second decimal place
- The intersection gives you the area under the curve to the left of your z-score
For example, to find the area for z = 1.25:
- Look for the row labeled 1.2
- Look for the column labeled 0.05
- The intersection gives approximately 0.8944, meaning about 89.44% of the data falls below a z-score of 1.25
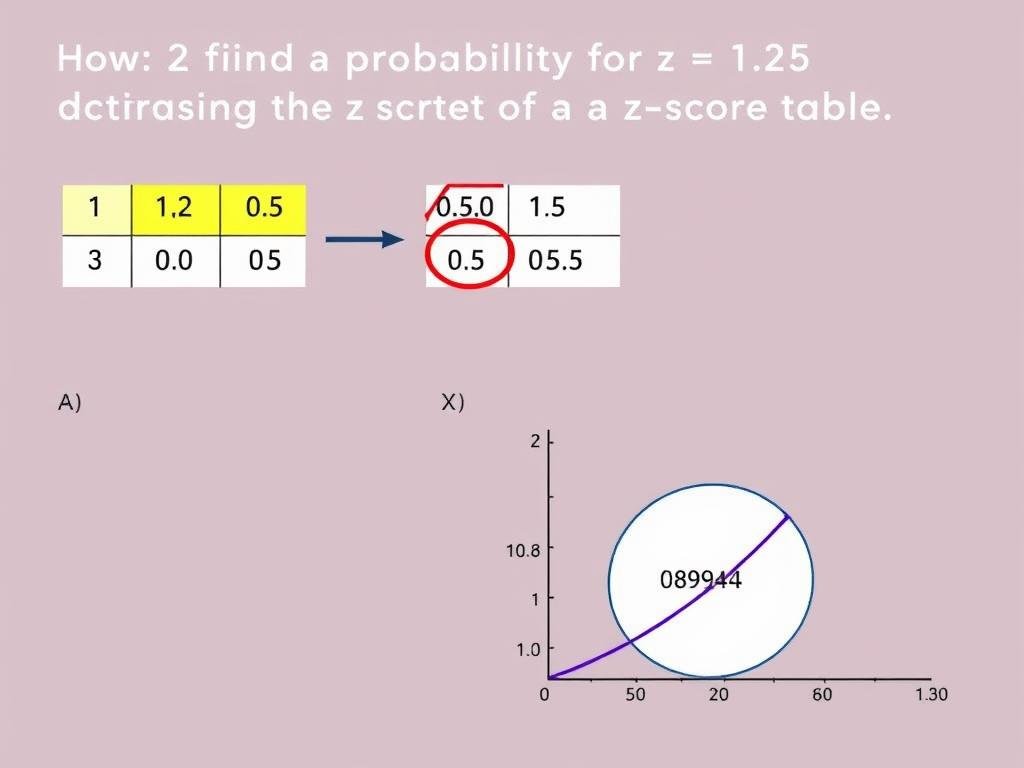
Finding the probability for z = 1.25 using a Z-score table
Common Z-score Table Applications
Z-score tables help you determine:
- The probability that a random variable is less than a specific value
- The probability that a random variable is greater than a specific value
- The probability that a random variable falls between two values
- The z-score corresponding to a specific percentile
While traditional z-tables are still taught in statistics courses, modern calculators and software have largely replaced manual table lookups for finding probabilities associated with z-scores.
Mastering Z-scores for Statistical Analysis
Z-scores are a powerful tool in statistics that allow you to standardize data, make meaningful comparisons across different distributions, and determine the relative position of data points. By understanding how to calculate and interpret z-scores, you gain valuable insights into your data that raw values alone cannot provide.

Summary of key Z-score concepts and applications
Whether you're a student learning statistics, a researcher analyzing data, or a professional making data-driven decisions, z-scores provide a standardized approach to understanding and comparing data across different contexts.
Z-scores transform the complex world of varying distributions into a common language that allows for meaningful statistical analysis and interpretation.
By mastering z-scores, you'll enhance your statistical literacy and gain a valuable tool for data analysis across numerous fields and applications.
Ready to put your Z-score knowledge into practice?
Our Z-score Calculator makes it easy to perform calculations and interpret results for your statistical analysis needs.
Frequently Asked Questions About Z-scores
What is the difference between a z-score and a t-score?
While both z-scores and t-scores are standardized scores, they're used in different contexts. Z-scores are used when the population standard deviation is known or when the sample size is large (n ≥ 30). T-scores are used when the population standard deviation is unknown and the sample size is small. T-scores use the sample standard deviation and follow the t-distribution rather than the normal distribution.
Can z-scores be negative?
Yes, z-scores can be negative. A negative z-score indicates that the data point is below the mean. For example, a z-score of -2 means the data point is 2 standard deviations below the mean.
What is a good z-score?
There's no universally "good" z-score as it depends on the context. In some cases, you might want values close to the mean (z-score near 0). In other cases, you might prefer high positive z-scores (above average) or low negative z-scores (below average). Generally, z-scores between -2 and 2 are considered within the normal range, covering about 95% of the data in a normal distribution.
How are z-scores used in hypothesis testing?
In hypothesis testing, z-scores help determine whether to reject the null hypothesis. By calculating a z-score for your test statistic, you can find the corresponding p-value, which indicates the probability of observing your results (or more extreme) if the null hypothesis is true. If this probability is below your significance level (typically 0.05), you reject the null hypothesis.
What's the relationship between z-scores and percentiles?
Z-scores can be converted to percentiles using a z-table or calculator. For example, a z-score of 0 corresponds to the 50th percentile (median), a z-score of 1 corresponds to approximately the 84th percentile, and a z-score of -1 corresponds to approximately the 16th percentile. This relationship allows you to determine what percentage of the data falls below a particular value.
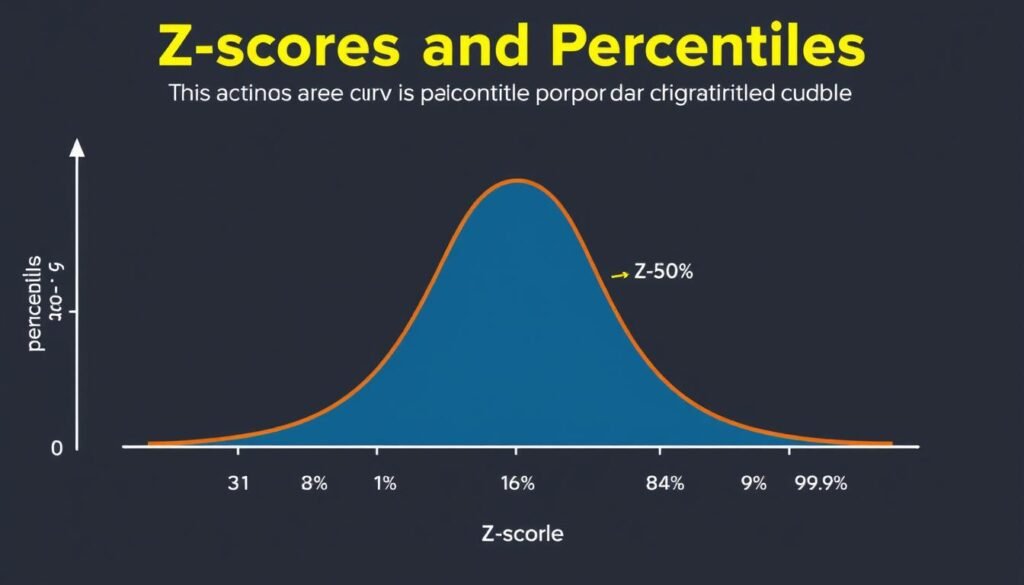
Z-scores and their corresponding percentiles on a normal distribution curve
Have more questions about Z-scores?
Our comprehensive Z-score Calculator includes additional resources and explanations to help you master statistical concepts.